


Today’s review is part of our month-long Special Series on Open Science Practices in addiction research. During this special series, The BASIS features recent publications that have used contemporary open science practices.
Imagine trying to choose between two scratch card games: one (Scratch Card A) that has ten $500 unclaimed prizes, and one (Scratch Card B) that has only one remaining $500 prize. Scratch Card A feels like the better choice because it has more prizes available to be won. However, on its own, unclaimed prize information is not useful in determining the chance of monetary gain. Now imagine that Scratch Card A has 10,000 cards for purchase, whereas Scratch Card B only has 10. With this additional piece of information, it is possible to calculate each game’s payback percentage– the percentage of money bet that is paid back to players overtime. Scratch Card B is actually a better choice because it has a higher payback percentage. Listing payback percentages might promote informed choice in gambling, because payback percentages are diagnostic and unclaimed prize information, on its own, is not. But, would people make use of payback percentages displayed on scratch cards? This week, The WAGER reviews a study that sought to answer this question.
What was the research question?
Do people ignore diagnostic information (i.e., payback percentages) in favor of easier to understand non-diagnostic information (i.e., unclaimed prize information) to make choices about buying scratch cards? Does diagnostic information have more value when it is simplified through graphical displays?
What did the researchers do?
The researchers ran two identical experiments, each with 201 participants recruited using Amazon’s Mechanical Turk. Participants viewed three variations of a scratch card that showed payback percentage and unclaimed prize information. In the first experiment, the researchers presented the payback percentages using a number and in the second experiment they presented payback percentages graphically with a star-rating. In Experiment 1, Scratch Card A had the most unclaimed prizes but the lowest payback percentage (67.89%), Scratch Card B had a medium number of unclaimed prizes and a medium payback percentage (68.14%), and Scratch Card C had the fewest unclaimed prizes but the highest payback percentage (68.39%). Everything was the same in Experiment 2 except instead of payback percentages, Scratch Card A had a one-star rating, Scratch Card B had a three-star rating, and Scratch Card C had a five-star rating. (The researchers told the participants that these stars represented a range from 67.89% to 68.39%.) Participants rated their card purchasing preferences and other reactions to each scratch card.1 The researchers hypothesized that presenting the payback percentage graphically would encourage participants to use payback percentages in their decisions (i.e., to prefer Scratch Card C).
The authors adopted open science practices by pre-registering their protocol on the Open Science Framework and making this article available online through open access.
What did they find?
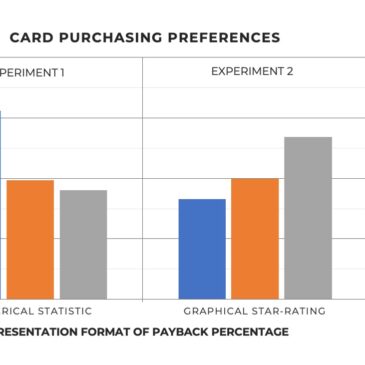
In the first experiment, when payback percentage was presented numerically, participants favored Scratch Card A, the card with the lowest payback percentage and highest number of unclaimed prizes. Participants felt more likely to win on this card and preferred purchasing this card over the other options. However, in the second experiment when payback percentage was depicted graphically with a star-rating, participants favored Scratch Card C, the card with the highest payback percentage and lowest number of unclaimed prizes. Participants rated their likelihood of winning as highest on this card and opted to purchase Scratch Card C over the others (see figure).
In both experiments, participants’ perceived usefulness and knowledge of payback percentage was similar, regardless of unclaimed prize information–meaning the graphical representation of the payback percentage did not increase their conceptual understanding of this statistic. This pattern of results suggests that although graphical depictions seem to weaken the influence of irrelevant but appealing information, they don’t necessarily do so by increasing understanding.

Figure. The mean number of each type of scratch card participants would hypothetically purchase, when payback percentage was depicted as a numerical statistic (Experiment 1) and when payback percentage was depicted as a graphical star-rating (Experiment 2). Click image to enlarge.
Why do these findings matter?
These findings suggest that participants’ gambling judgments were biased by unclaimed prize information only when the payback percentage was presented as a number. When the payback percentage was presented in an easy-to-understand graphic, participants used this information instead, making optimal gambling decisions by favoring the card with the highest payback percentage. Presenting informative statistics in a graphical format may encourage people to use this information. Responsible gambling strategies– and public health interventions more generally– that aim to promote informed choice should focus not only on what information is being presented, but also how this information is presented.
Every study has limitations. What are the limitations of this study?
This study was conducted with a hypothetical scratch card gambling scenario, so its findings may not be generalizable to real-world gambling contexts. Also, in Experiment 2, the graphics might have made the differences in the scratch cards’ payback percentages appear larger than they were intended to appear, despite the researchers’ instructions.
For more information:
Are you or someone you know experiencing problems with gambling? Visit the National Council on Problem Gambling for screening tools and resources. For additional resources, including gambling and self-help tools, visit The BASIS Addiction Resources page.
— Kira Landauer, MPH
What do you think? Please use the comment link below to provide feedback on this article.
________________
1. To investigate purchasing preferences, participants were asked to state how many of each type of card they would hypothetically purchase, if each card cost $5.00.
Don Feeney January 28, 2020
The problem with this analysis is that an unclaimed prize is not necessarily an unpurchased prize. It’s entirely possible, and not necessarily irrational, for a player faced with the above scenario to think that with 10 tickets left (and there is no way posted information could be that current) the chances are pretty good that the one big prize has been purchased but not claimed. In fact, that’s far more likely than the chance that the prize hasn’t been purchased. However, with 10,000 cards available, the chance that a winner is still actually available is likely greater, and what the authors see as a less than optimal choice may, in fact, be the more rational option.