


In the past two issues, The WAGER reported on research by Slutske, Jackson, and Sher (2003) that examined the trajectory and prevalence of gambling problems among college students. This research, which found lower rates of college students with problems due to gambling than previously reported, utilized an 11-year longitudinal design to investigate both past-year and lifetime self-reports of gambling problems at four different time points. This week’s WAGER concludes our review of Slutske et al’s (2003) study with a look at reported lifetime prevalence of gambling problems across the 11 years of the study.
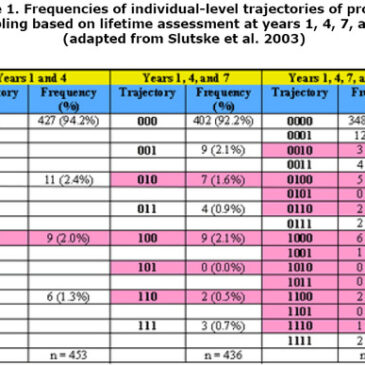
In addition to past-year reports of gambling problems, Slutske et al. had participants complete lifetime assessments at all four data collection points (years 1, 4, 7, and 11). These assessments consisted of responses to a set of questions about whether the respondent had ever experienced symptoms of pathological gambling.1 Because few participants endorsed any symptoms in any of the assessment years, the authors used endorsement of one or more symptoms as their definition of problem gambling. Table 1 summarizes the different patterns of lifetime reporting that were possible across the four assessments and the number of participants who reported each pattern. Each trajectory is represented by a series of 1s and 0s. A 1 reflects a report of a gambling problem at any time in the past and a 0 represents a report of no gambling problem at any time in the past. The 1s and 0s are ordered according to the assessment year in which they were reported. Thus, the sequence “10” indicates a report of having experienced a gambling problem at some time by year 1 of the study, but no such endorsement at year 4. A trajectory of “1011” indicates the endorsement of a lifetime gambling problem at year 1, no such endorsement at year 4, and a return to endorsement at years 7 and 11. These patterns and others with 0s following 1s are logically inconsistent and are highlighted in Table 1. The table contains three aggregates of reporting periods — years 1 and 4, years 1, 4, and 7, and years 1, 4, 7, and 11.

Similar to the past-year assessments of gambling problems reported in the last WAGER, more than 90% of participants in Slutske et al.’s study reported never having experienced symptoms of problem gambling across all years that they were assessed. However, although the percent of participants reporting lifetime gambling problems at a given assessment only varied from 3.2% at year 1 to 5.3% at year 11 (WAGER 8(26)), the percent of participants reporting lifetime gambling problems at any of their assessments was 10.3% for the sample who completed all four assessments (n = 388). Incidence (i.e., the percent of participants reporting a problem not previously endorsed) accounts for the increase in percent reporting a lifetime gambling problem from year 1 to year 11. Negative incidence (i.e., the percent of participants failing to report a problem endorsed previously) accounts for the discrepancy between percent endorsing a lifetime gambling problem at year 11 and percent endorsing a lifetime gambling problem at any point during the study. Consider the last two columns in Table 1 as an illustration. Of the 40 participants who reported having ever experienced gambling problems, 2 (0.5% of the sample) reported these problems across all four assessments, 18 (4.6% of the sample) reported problems after the first assessment and continued to endorse them consistently at the other assessments, and 20 (5.2% of the sample) reported problems at some point during the study but failed to report them at a later assessment.2 Thus, the lifetime prevalence estimate based on the year 11 endorsements for this group is 5.2%, but the prevalence increases to 10.3% when the inconsistent reports (the shaded cells in the last two columns of Table 1) are included.
When examined carefully, this research reveals much more than just a low prevalence of problem gambling among college students. Slutske et al.’s comparison of lifetime reports at different assessments clearly reveals the drawbacks of retrospective self-report. In this project, half of the participants who reported ever having experienced a gambling problem during one of the assessments failed to report that problem later in the study. This finding, while surprising, is corroborated by an abundance of memory research. In general, people are less likely to recall life events as the time from that event increases (Tourangeau, 2000). Since the participants in Slutske et al.’s study were classified as problem gamblers if they endorsed only one symptom, it is possible that these experiences were less memorable than the “life events” described by Tourangeau. In addition, multiple researchers have found memory for life experiences to be affected by current moods, attitudes, and beliefs (Neisser & Fivush, 1994). People often reconstruct their memories of past events from their current experiences (Conway & Ross, 1984). Thus, in Slutske et al.’s study, participants who reported no gambling problems at the time of a given assessment may have used their current state to determine whether they had ever had a gambling problem, resulting in inconsistent reports. Because of Slutske et al.’s inclusion of multiple self-report measures of gambling problems at multiple time points, their study was able to provide valuable information about self-report biases. These findings call into question previous estimates of gambling problem prevalence based on lifetime reports and highlight the importance of comparing measures and methodologies when conducting studies of gambling problem prevalence and incidence. Finally, even though these data reveal self-report biases, they also reflect the dynamic nature of gambling problems. The tendency for people to fall in and out of gambling problems, left unmeasured by most studies, challenges previous notions of gambling disorders as chronic and progressive.
Comments on this article can be addressed to Sarah Nelson at wager@hms.harvard.edu
Notes
1 In year 1, 4 questions from the DSM-III criteria for pathological gambling were included; in years 4 and 7, all 9 items from the DSM-III criteria were included; in year 11, all 10 items from the DSM-IV criteria were included.
2 These percentages and the ones that follow are based on the sample of participants (n = 388) who completed all four assessments
References
Conway, M. A., & Ross, M. (1984). Getting what you want by revising what you had. Journal of Personality and Social Psychology, 47, 738-748.
Neisser, U. & Fivush, R. (Eds.) The remembering self: Construction and accuracy in the self-narrative. New York: Cambridge University Press.
Slutske, W. S., Jackson, K. M., & Sher, K. J. (2003). The natural history of problem gambling from age 18 to 29. Journal of Abnormal Psychology, 112, 263-274.
Tourangeau, R. (2000). Remembering what happened: Memory errors and survey reports. A. A. Stone, J. S. Turkkan, C. A. Bachrach, J. B. Jobe, H. S. Kurtzman, V. S. Cain (Eds.), The science of self-report: Implications for research and practice. Mahwah: Lawrence Erlbaum Associates.
The WAGER is a public education project of the Division on Addictions at Harvard Medical School. It is funded, in part, by the National Center for Responsible Gaming, the Massachusetts Department of Public Health, the Substance Abuse and Mental Health Services Administration, and the Center for Substance Abuse Treatment.