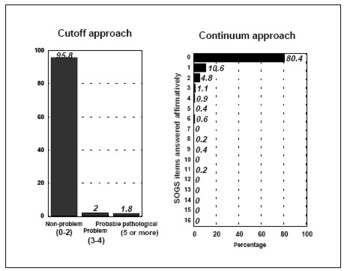
Historically, two distinct approaches have been used to report on the criteria for “pathological gambling”. The more common approach is the use of a cutoff score. That is, on a scale made up of a number of items, if an individual meets a predetermined number of criteria (e.g., answers affirmatively to 5 or more items), that individual is considered to have a pathological gambling disorder. The second, less popular approach is the continuum. In this approach, disordered gambling is considered to be not a dichotomous phenomenon (i.e., is or isn’t pathological), but rather exists on a continuous scale. A lower score indicates a lower degree of gambling problems while a higher score indicates a higher degree of gambling problems. There are advantages and disadvantages to each method. The cutoff approach creates a single estimate of pathological gambling (e.g., 2.5%) which can be readily compared with other studies that employ the same instrument (e.g., SOGS). The DSM uses the cutoff approach because it assists clinicians in determining which patients need to be treated for a pathological gambling disorder. A disadvantage of the cutoff method is that the cutoff is arbitrary. Some researchers consider 0-2 items for the SOGS to be “non-problem gambling” while others believe that only 0 indicates a state of non-problem gambling. Similarly, the exact place for the “pathological” cutoff can be debated. One advantage of the continuum is that it may represent more accurately the nature of pathological gambling. Data reported in the continuum approach is more versatile for research purposes. If different scientists have used different cutoffs, their studies can be compared by standardizing the cutoffs. In addition, mean scores can be computed for research purposes. Another advantage is that if the continuum is used, cutoffs can also be reported; if only the cutoff approach is presented, the continuum remains unknown. One disadvantage of the continuum approach is that it relatively unfamiliar within the gambling research field. It also challenges the reader to examine the entire pattern of gambling-related problems, which to some may be an advantage, and to others a disadvantage. The following chart gives examples of each approach from the same study data*.
Source: *Baseline Market Research Ltd. (1996). Final report: 1996 prevalence study on problem gambling in Nova Scotia (Prepared for Nova Scotia Department of Health). Halifax, Nova Scotia: Author.
This public education project is funded, in part, by The Andrews Foundation.


