
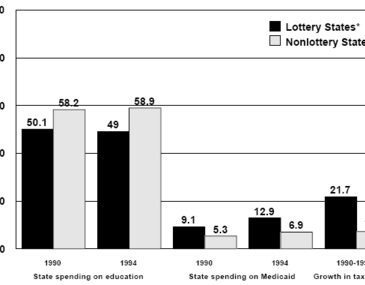


During 1995, lottery sales from 36 states and the District of Columbia rose to $32.1 billion. States often enter the lottery business, in part, to gain the revenue necessary to support public education. Money for education is usually one of the explicit or implicit promises that most state legislation offers when it suggests chartering a lottery. However, Money magazine conducted a six-month investigation revealing that state lotteries have failed to boost funding for education. The proportion of state spending dedicated to education has remained relatively unchanged in the 1990s, about 50% for lottery states and 60% for non-lottery states, despite the growth in lottery revenues. In addition, states with lotteries are spending more of their budget on Medicaid bills than states without lotteries. Similarly, over the past five years tax revenue in states with lotteries increased 21.7% (per capita $1,401 per year), while in states without a lottery tax revenues increased 7.2% (per capita $1,049 per year).

*Excludes the four states that created lotteries after 1990.
Source: Keating, P. (1996, May). Lotto fever: We all lose! Money, pp. 142-149.
This public education project is funded, in part, by The Andrews Foundation and the Massachusetts Department of Public Health.
This fax may be copied without permission. Please cite The WAGER as the source.
For more information contact the Massachusetts Council on Compulsive Gambling, 190 High Street, Suite 6, Boston, MA 02110.