


In 2018, over 10,000 people died from a motor vehicle crash involving positive blood alcohol concentrations (BAC). Over 10,000! Interestingly, a significant portion (15%) of alcohol related crashes involve drivers below the federal blood alcohol legal limit of 0.08%. How are these accidents different from the more publicized accidents with drivers’ BAC over the legal limits? Marlene Lira and her colleagues aimed to better understand the characteristics behind these less-considered yet nonetheless tragic events.
What was the research question?
What makes lower BAC crash fatalities different from higher BAC crash fatalities?
What did the researchers do?
Data on crash fatalities from 2000-2015 were taken from the National Highway Traffic Administration’s Fatality Analysis Reporting System. These records included all crashes from all 50 states that resulted in at least one fatality within 30 days of the crash. For each person who died, the data set contained demographics, driver/passenger status, and BAC. The data also included crash details such as time of crash and number of vehicles.
What did they find?
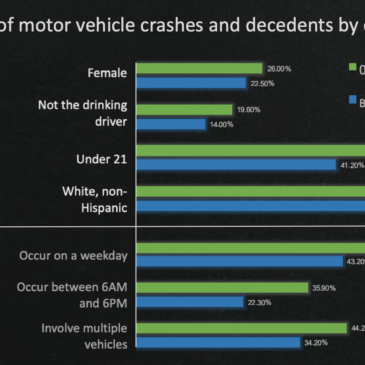
Between 2000 and 2015 there were 612,030 crash fatalities and 223,471 (37%) involved one or more drivers with a positive BAC. Of these, 33,965 (15% of positive BAC crashes) were from a driver with a BAC between 0.00% and 0.08% (in other words, under the legal limit). In comparison with crashes at or above the BAC limit, those with drivers below the BAC limit were more likely to involve multiple vehicles, take place during the day, and happen on weekdays. Those who died in these crashes were more likely to be female, not the drinking driver, under 21, and white, non-Hispanic (see Figure). Notably, 54.8% of decedents in lower-BAC crash fatalities were not the drinking driver but instead someone else involved in the accident (not shown).

Figure. Characteristics of motor vehicle crashes and crash decedents by crash-level BAC. This figure shows all of the statistically significant differences found between low- and high-BAC crash fatalities. For example, the bottom two bars demonstrate that low-BAC crashes were more likely to involve multiple vehicles than high-BAC crashes. Click image to enlarge.
Why do these findings matter?
Most of the people who died in low-BAC crashes were not the drivers who had been drinking. In other words, those experiencing the majority of the harm were not behind the wheel. Also, low-BAC crash decedents were also more likely to be under 21. What is the best way to prevent DUI among people who shouldn’t even be drinking yet? Additionally, these accidents are more likely to happen during the weekday, during the day, and involve multiple cars – a sobering reminder that it is important to drive defensively at all times of the day. Understanding the characteristics within this lower BAC range will help inform policy makers about who is experiencing the majority of the harm and possibly help inform more targeted interventions and policies.
Every study has limitations. What are the limitations in this study?
The authors didn’t compare these types of crashes to crashes that didn’t involve any alcohol. The characteristics of the lower-BAC crashes could potentially be the same as those that don’t involve alcohol. Without this information it’s difficult to know if low BAC driving is any different than 0% BAC driving.
For more information:
The National Institute for Alcohol Abuse and Alcoholism has tips and resources for people struggling with problem drinking. For drinking self-help tools, visit The BASIS Addiction Resources page.
— Alex LaRaja
What do you think? Please use the comment link below to provide feedback on this article.