Special Notes: This week’s WAGER was co-authored by Alexa Rubenstein, an intern at the Division on Addictions. She will be a sophomore at Harvard University next fall, where she is concentrating in psychology.
This week’s Guest Editor is Gavin Michael LaPlante Forbes, 9lbs 9 oz 21 in., born 8/7/04 to the WAGER’s previous Editor, Debi LaPlante.
The rapid casino growth and increased gaming participation rates in the United States during the past decade have raised concern among social observers that disordered gambling might become a new epidemic. However, to understand the current trends in gambling expansion, we need to set them in historical context. The expansion of multi-million dollar casinos is new, but the United States’ struggle with the regulation and consequences of problem gambling is not. Ever since the first lottery on American soil was held during the 1600’s to raise revenues to develop Jamestown, Virginia, Americans have been gambling in some form or another. Similarly, since the 1600’s, the government has been alternately outlawing, legalizing, and sponsoring different forms of gambling (Dunstan, 1997). This week’s WAGER uses Gallup Organization polls1 of nationally representative samples and historical information from the California Bureau of Research (Dunstan, 1997) to compare the current trends in casino gambling behavior and approval to historical trends in lottery involvement and opinion.
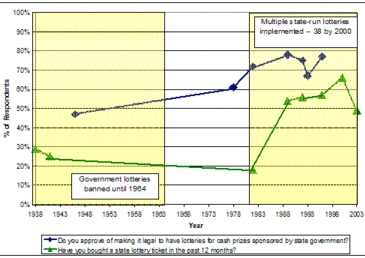
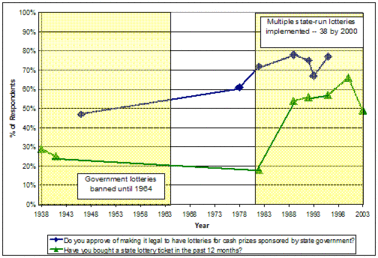
Lotteries, one of America’s oldest forms of gambling, also have been one of the most popular. In 1938, despite a ban on all government lotteries, a Gallup poll found that 29% of those polled reported playing a church lottery that year. In 1982, almost 20 years after that ban was lifted, fewer people (18%) reported playing the state lottery than had reported church lottery participation in 1938.
When considering shorter time periods, lottery participation does appear to relate to government actions. As Figure 1 shows, participation clearly dipped between 1938 and 1941 (i.e., from 29% to 24%), during which time the government cracked down on illegal lotteries. When states rapidly began implementing lotteries during the 1980s (i.e., from 15 state-run lotteries in 1982 to 32 in 1989), participation rates also rapidly increased, from 18% in 1982 to 54% in 1989. As of 1996, more than 50% of respondents polled by Gallup reported playing, and by 2000, when 38 states had legalized lotteries, a separate source (Welte, Barnes, Wieczorek, Tidwell, & Parker, 2002) found that 66% of a representative sample reported playing.
Figure 1. Lottery Play and Approval – 1938, 1941, 1946, 1978, 1982, 1984, 1989, 1992, 1993, 1996, 2002 (2), 2003 (3)
Figure 1 shows that approval of lottery play followed a slightly different path than lottery participation. Lottery participation in 1982 was similar to if not lower than participation in 1938, but approval of government lotteries had increased by more than 20% since 1946, from 47% to 72%. Between 1982 and 1989, approval continued to increase, from 72% to 78%. In each poll, lottery approval exceeds participation, but that gap appears to be closing from a maximum difference of 54% in 1982 to 20% in 1996.
Lottery participation and monthly spending per player also follow different paths. The percent of people who played the lottery increased slightly from 54% to 57% in the period from 1989 to 1996. However, the amount each individual spent monthly decreased. In 1989, Gallup poll respondents spent an average of $53 a month on lottery tickets, but by 1996, the average monthly expense decreased to $12.38. Since 1996, the average monthly lottery expenditure has increased to $18.53 in 2003, but the percent of people who played the lottery dipped to 49%.4 We discuss these results in more detail below.
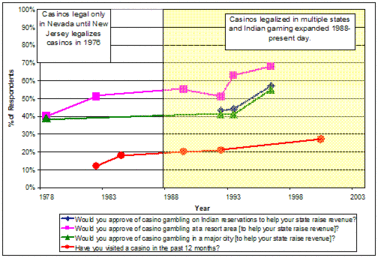
Since the expansion of casino gambling beginning in 1978, states have followed the lead of previous states in legalizing casinos. This trend is similar to the way more and more states implemented lotteries once New Hampshire started the first one in the modern era. Eleven states now have commercial casinos, and since the Indian Gaming Regulatory Act in 1988, twenty-three states include casinos operated by American Indian tribes. In total, 27 states have some form of casino gambling. As seen in Figure 2, Gallup polls show that initially, participation in casino gambling increased accordingly among respondents, just as lottery participation increased during the state-run lottery boom of the 1980s.
Although only 12% of respondents in the 1982 survey said they had visited a casino, 51% approved of casino gambling at resorts to help states raise revenue. Once multiple states began legalizing casinos in the late 1980s, visiting rates increased from 12% in 1982 to 20% in 1989 and, according to a separate source (Welte et al., 2002), increased to 27% in 2000. The approval ratings followed a similar pattern of increase, starting at 39-40% in 1978 and climbing to 41-51% in 1992 and 55-68% in 1996. Gallup did not provide comparable data on money spent casino gambling.
Figure 2. Casino Play and Approval – 1978, 1982, 1984, 1989, 1992, 1993, 1996, 2000 (2)
If we consider only the lottery and casino booms of the 80’s and 90’s, the trends appear clear. Participation and approval for both lotteries and casino have increased in response to the government legalizing these activities; however it also is possible that governments legalized these activities in response to the electorate’s increasing interest in gambling. The longer time span of data for lotteries provides a broader context for interpreting the evidence. Lottery participation in 1938, pre-government lottery legalization, is higher than state lottery participation in 1982, almost 20 years after government lottery legalization. Any number of patterns could have occurred between those two time points: whatever did occur leveled out by 1982. Respondents in 1982 did not play the state lotteries any more than respondents in 1938 played non-governmental lotteries. Similarly, the increased lottery participation of the 1980’s has leveled off, other than a slight increase in 2000.Taken together, this national data suggests that gambling approval is a function of the length of time a game has been legalized, as well as a possible driving force of legalization. Like, participation, approval for gambling does not show a linear trend.
Perhaps these results are best explained by reference to a pendulum. There is little question that the legalization of gambling affects both participation rates and approval ratings, but figures 1 and 2 provide preliminary evidence that these increases level off with time. Gamblers adapt to the novelty of new opportunities to gamble and participation rates appear to dip: approval ratings, although primarily related to the novelty of the activity, do fluctuate, and might themselves influence gambling participation or legislation.
Clearly, these results are limited by the gaps in the data and the representativeness of the Gallup poll samples. In addition, these trends tell us about gambling participation, not gambling problems or consequences. For example, we know from the lottery data that reported lottery participation and reported spending on the lottery are not positively correlated – that is, the average amount spent on lotteries does not increase when participation increases. In fact, in the Gallup data spending appears to decrease as participation increases. Perhaps, as a certain form of gambling becomes more normative, more people play, but devote fewer resources. When a gambling activity is less normative, those who do play tend to be avid gamblers. Participation, while it might be a useful marker, is not itself a barometer of disorder. Research needs not only to place current gambling trends in their historical context, but also investigate the relationship between trends in participation and the incidence and prevalence of gambling disorders.
Comments on this article can be addressed to Alexa Rubenstein or Sarah Nelson.
Notes
1 Gallup polls, conducted by the Gallup Organization use representative United States samples. Gallup calculates its margin of sampling error (confidence interval — CI) as 1/vN (Moore, 2004). The Gallup polls cited have sample sizes of 3,015 (September, 1938; CI = +-2%), 2,933 (September, 1941; CI = +-2%), 2,064 (March, 1946; CI = +-2%), 2,700 (May, 1978; CI = +-2%), 1,972 (April, 1989; CI = +-2%), 1,625 (November, 1992; CI = +-2%), 802 (September, 1993; CI = +-4%),1,005 (June, 1996; CI = +-3%), 1,010 (December, 2003; CI = +-3%) (The Gallup Organization, 2004). We were not able to obtain sample sizes or CI’s for the 1982 or 1984 Gallup polls.
2 The data point from the year 2000 derives not from Gallup data but from a study conducted in 2000 by Welte et al. (2002).
3 In 1938 and 1941, the Gallup poll question about lottery participation slightly differed from that listed in Figure 1. Because no state lotteries were legal at that time, respondents were asked whether they had bought a ticket in a church lottery or raffle.
4 For the lottery expenditure numbers, data points are based on sub-samples of respondents who reported playing the lottery in the last year: 1,057 in 1989 (CI = +-3%), 572 in 1996 (CI = +-4%), and 497 in 2003 (CI = +-4%).
References
Dunstan, R. (1997). Gambling in California (No. CRB-97-003). Sacramento, CA: California Research Bureau.
Moore, D. W. (2004). State lottery tickets most popular form of gambling, from Gallup News Service,
http://www.gambletribune.org/print893.html
The Gallup Organization. (2004). Gallup Brain, 2004, from http://brain.gallup.com
Welte, J. W., Barnes, G. M., Wieczorek, W. F., Tidwell, M.-C., & Parker, J. (2002). Gambling participation in the U.S. — Results from a national survey. Journal of Gambling Studies, 18(4), 313
337.


