


The past two issues of The Wager examined the Adult Survey portion of the Gambling Impact and Behavior Study, conducted by the National Opinion Research Council (NORC) in 1998 as part of a contract with the National Gambling Impact Study Commission (Gerstein et al., 1999).1 Part 1 discussed the methods employed by NORC and the data obtained on the prevalence of problem and pathological gambling. Part 2 investigated the relationship between levels of problem gambling and gambling outcomes among patrons of gambling venues. The final part of The Wager’s analysis examines specific gambling problems and how they affect gambling behavior in more detail.
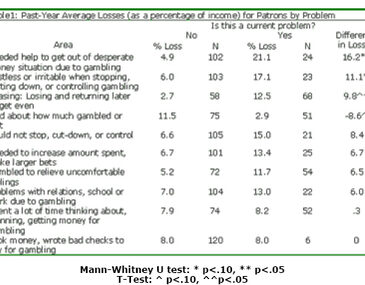
The NORC DSM-IV Screen for Gambling Problems (NODS) defines ten problem areas, based upon the ten diagnostic criteria for pathological gambling in the DSM-IV. The Wager analyzed the group of patrons who had at least one gambling problem during the past year (N=126), and compared the average losses (as a percentage of income) of those who fulfilled each of the criteria with those who did not. T-tests and Mann-Whitney U-tests were performed to determine the significance of the differences between the two groups. Table 1 contains the results of this analysis.

Mann-Whitney U test: * p<.10, ** p<.05
T-Test: ^ p<.10, ^^p<.05
In general, those who displayed a given gambling problem lost more than those who did not. In particular, those who chased (returned to win back prior losses) and those who needed help to get out of a money situation caused by gambling lost 4.6 and 4.3 times what those who did not have these problems lost, respectively. Two problem areas revealed little or no difference between those who had the problem and those who did not. Only six patrons reported writing bad checks or taking money from others to pay for gambling, making analysis of this problem less reliable. Respondents could have been more reluctant to admit to illegal activities than to the other problem areas in the survey.
One problem area reversed the trend: having lied about how much was gambled or lost. Patrons who said they lied about their gambling outcomes reported losing 2.9% of their annual income, which was only a fourth of the average losses (11.5% of annual income) of patrons who said they did not lie. Lying to others about gambling outcomes was the fourth most prevalent reported problem. Fifty-one patrons with problems said they lied, including 79% of Level 3 gamblers and 54% of Level 2 gamblers. The relatively small losses reported by these patrons suggest that they might also have lied to the interviewers. The six Level 3 gamblers who said they did not lie lost an average of 59.2% of their annual income during the past year.
Last week’s issue of The Wager, reported a significant and consistent linear relationship between level of problem gambling and amount of money lost. The average losses in the last year from casino and lottery wagers increased by 5% of annual income as the level of problem gambling increased. A more detailed examination shows that lying was frequently reported, particularly by Level 2 and Level 3 gamblers. If the respondents who admitted to lying about the results of their gambling also understated their losses to the NORC interviewers, the differences in losses between levels would be more extreme. Underreporting of outcomes may compromise the NORC patron survey information on the relationship between amount of money lost and gambling problems.
The Wager’s analysis of the NORC study revealed several factors that call its validity into question. Because pathological gambling has such a low prevalence in the general population (e.g., Shaffer, Hall and Vander Bilt report 1.14% for past-year Level 3), obtaining a sufficiently large sample of problem gamblers to support in-depth analyses of the data is difficult (Shaffer, Hall, & Vander Bilt, 1997). Consequently, the only part of NORC’s Adult Survey that had enough problem gamblers for analysis was the patron portion. This sample, however, has questionable applicability to the general population, and extremely low response rates at some of the interview sites undermine the validity of the data. Finally, an in-depth examination of specific problem areas revealed the possibility that many patrons may have provided false data, which undermines any conclusions that could be drawn from the study. Though the NORC efforts were an ambitious attempt at obtaining national gambling information, further analysis is needed to determine whether NORC achieved its goals.
[1] The NORC reports are currently accessible to the public, and can be obtained from their website here. The codebooks and data can be found here.
References
Gerstein, D., Murphy, S., Toce, M., Hoffmann, J., Palmer, A., Johnson, R., Larison, C., Chuchro, L., Bard, A., Engelman, L., Hill, M. A., Buie, T., Volberg, R., Harwood, H., Tucker, A., Christiansen, E., Cummings, W., & Sinclair, S. (1999). Gambling Impact and Behavior Study: Report to the National Gambling Impact Study Commission. Chicago: National Opinion Research Center.
Shaffer, H., Hall, M., & Vander Bilt, J. (1997). Estimating the Prevalence of Disordered Gambling Behavior in the United States and Canada: A Meta-analysis. American Journal of Public Health.