


This week’s issue of The Wager continues our analyses of the Adult Survey portion of the National Opinion Research Center’s (NORC) Gambling Impact and Behavior Study (Gerstein et al., 1999).1 The Adult Survey consisted of two separate data collections; a phone survey of 2,417 household residents, and interviews with 530 patrons of gambling sites. The study aimed to obtain data about levels of problem gambling, amounts wagered, amounts won and lost, and income for both samples. Unfortunately, only 12 residents, comprising 0.5% of the sample, reported experiencing three or more gambling problems in the past year, severely limiting the usefulness of that data set (See last week’s issue of The Wager for more complete methods and results for the gambling problem portion of the survey). The patrons sample, however, does provide some interesting information about the relationship between levels of problem gambling and the size of gambling outcomes.
NORC asked the patrons of casinos, racetracks, and lottery and video lottery terminal (VLT) sites how much money they had won or lost during the past year and on the last day they gambled for various gambling activities. Investigators asked the past year question about casinos and the lottery, but not about racetracks, even though 56 respondents were recruited from racetracks. Additionally, they asked for the total amount won or lost on the last day only about casinos, racetracks or frontons, and stores, although 193 respondents came from lottery or VLT sites (a similar question about the total amount spent on the last day was asked about the lottery). The study also gathered data on the respondents’ income from sources other than gambling. Each response was placed in a dollar category (e.g. under 100, 101-500, 501-1,000, etc. for outcomes, and under 24,000, 24,000-49,999, etc. for income). The Division assigned each category a specific dollar value set at its midpoint to preserve the difference in actual dollars between the categories. We also calculated the amount of money won or lost as a percentage of annual income, to take into account the relative value of absolute dollars across different income levels.
Of the 530 patrons surveyed, 515 had gambled in the past year, and 503 provided data on past year gambling outcomes from casino gambling and lottery play, the two types of gambling for which past year data from patrons was available. Two patrons chose not to answer questions about their annual income. The average gambling outcome for the past year among patrons was a loss of $606, representing an average loss of 2% of annual income. The largest reported loss was in the range with a midpoint of $33,000, while the largest winning was $75,000. The largest loss as a percentage of income was 231%, and the largest win as a percentage of income was 81%. The majority of patrons (60%), however, won or lost less than 1% of their annual income.
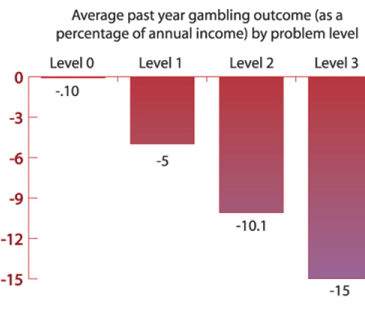
The results of an analysis to investigate the relationship between problem gambling and gambling outcomes revealed that there was a statistically significant linear relation between the level of problem gambling and the amount of money won or lost over the past year, both in dollars and as a percentage of annual income2. Figure 1 illustrates the findings.

The NORC study supports the reasonable expectation that gamblers with more problems are likely to lose more money. However, the patron portion of the Adult Survey has only limited applicability to understanding the relationship between wager amounts and problem gambling. The interviewers did not ask patrons about several types of gambling, including those featured at some of the sites where the interviews were conducted. The response rates at some of these sites were also very low. Most noticeably, the response rate for pari-mutuels, which in this case includes only racetracks, was 26%. None of the others was above 70%, and the overall rate was 50%. Other constraints on the utility of the patron study were revealed by an analysis of specific gambling problems. Next week’s Wager will address these issues and conclude our analysis of the NORC study.
[1] The NORC reports are currently accessible to the public, and can be obtained from their website here. The codebooks and data can be found here.
[2] The relationship was found for both absolute dollars and dollars relative to income because there was no variation in average income across levels of problem gambling.
References
Gerstein, D., Murphy, S., Toce, M., Hoffmann, J., Palmer, A., Johnson, R., Larison, C., Chuchro, L., Bard, A., Engelman, L., Hill, M. A., Buie, T., Volberg, R., Harwood, H., Tucker, A., Christiansen, E., Cummings, W., & Sinclair, S. (1999). Gambling Impact and Behavior Study: Report to the National Gambling Impact Study Commission. Chicago: National Opinion Research Center.
The WAGER is a public education project of the Division on Addictions at Harvard Medical
School. It is funded, in part, by the National Center for Responsible Gaming, the
Massachusetts Department of Public Health, the Addiction Technology Transfer Center of
New England, the Substance Abuse and Mental Health Services Administration, and the
Center for Substance Abuse Treatment.