


In April of 1998, the National Gambling Impact Study Commission (NGISC) contracted the National Opinion Research Center (NORC) at the University of Chicago to help in collecting valid data that would aid the creation of informed recommendations and legislation regarding gambling issues. The resulting study consisted of five separate data collections that attempted to provide nationwide gambling prevalence rates (Gerstein et al., 1999). The only other study of this kind was conducted in 1976 by the Commission on the Review of the National Policy Toward Gambling (Kallick, Suits, Dielman, & Hybels, 1979). Thus, the NORC efforts compose a watershed study that gives data on a scale that was previously unavailable. The next three issues of The WAGER will present the results from our examination of the data collected in the Adult Survey portion of the Gambling Impact and Behavior Study.
The NORC reports are currently accessible to the public, and can be obtained from their website. The codebooks and data can be found here.
The Adult Survey contains two of the five data collection initiatives NORC undertook to achieve the goal of national gambling behavior information: a phone survey of 2,417 adults in their households
(i.e. residents) and interviews with 530 individuals intercepted at gambling venues (i.e. patrons). 150, 64, and 67 patrons were recruited from traditional casinos, riverboat casinos, and tribal casinos, respectively. NORC recruited 193 respondents from lottery and video lottery terminal (VLT) sites, and 56 from racetracks. The surveys examined the prevalence of gambling and gambling problems in the US adult population, the amount of money spent on gambling activities, and the relationship between gambling and income, along with other variables that we will not address. Respondents were asked about gambling outcomes over the past year and on their last day of gambling. Interestingly, while residents were asked the past year and last day question about ten different gambling sources, patrons were asked both only for casino gambling; the last year question was not asked for racetrack gambling and the last day question was not asked for lottery gambling.
This issue of The WAGER will discuss the prevalence estimates obtained by NORC for both the resident and patron populations. Next week’s issue will study the relationship between the level of problem gambling and the amount wagered for the patron population only, for reasons that will be discussed below. The final segment on the NORC study will provide a more in-depth view of this relationship, analyzing how specific gambling problems connect to wagers and gambling outcomes
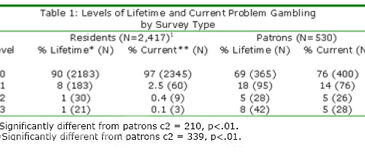
NORC developed an original instrument, the NORC DSM-IV Screen for Gambling Problems (NODS), to determine the prevalence of problem and pathological gambling, for both the lifetime and past year timeframes. It used the DSM-IV criteria for pathological gambling to define four levels of problem gambling: Level 0=no problems; Level 1=1 or 2 problems; Level 2=3 or 4 problems; and Level 3=5 or more problems. Table 1 provides the prevalence for each level in both study groups, residents of the general household population and patrons of gambling settings.

*=Significantly different from patrons c2 = 210, p<.01.
**=Significantly different from patrons c2 = 339, p<.01.
The prevalence of problem gambling was significantly larger among patrons than residents, with 24% of patrons experience some problem in the past year, versus only 3% for residents. A striking feature of these results, however, was that only 12 residents (0.5%) reported problem gambling at Level 2 or 3 during the past year. The small number of observations reveals the difficulties inherent in conducting a national study of gambling prevalence. The low rates for problem gambling among the adult general population (Shaffer, Hall, and Vander Bilt (1997) identify a past-year rate of 1.14% for disordered gamblers) dictate large sample sizes and extensive costs for any study wishing to obtain representative data (Shaffer, Hall, & Vander Bilt, 1997). Unfortunately, the current data set precludes confident analyses of the other characteristics of problem gamblers in the general household population. Thus, for the next two issues of the Wager, the discussion will be limited to the patron portion of the NORC study’s Adult Survey.
[1] Interestingly, there were five patrons who had more problems in the past year than in their lifetime. Such inconsistencies could be due to interviewer mistakes or confusion or dishonesty on the part of the respondent, but they occurred on a small enough scale to be accepted for the remainder of the analysis.