According to the single distribution theory (Rose, 1992, 1985), a change in the prevalence of a characteristic (i.e., the number of people who gamble) will cause a similar change throughout the distribution of this characteristic (i.e., level 1, 2, and 3 gamblers). Grun and McKeigue (2000) studied the relationship between the single distribution theory and excessive[1] gambling in the United
Kingdom (UK).
Grun and McKeigue (2000) examined the single distribution theory’s prediction that the increase in gambling expenditure that occurred after inception of the UK’s national lottery would be associated with a similar and proportionate increase of excessive gamblers. To test this hypothesis, the investigators analyzed data from the Family Expenditure Survey[2] (Office for National
Statistics, 1996). This survey was conducted one full year before (i.e., 1993-1994) and one full year after (i.e., 1995-1996) the implementation of the UK’s national lottery.
The results provide some support for the single distribution theory of gambling (Grun & McKeigue, 2000). Specifically, in 1993-1994, 40% of households surveyed were gambling 0.5% (£1.45) of their weekly income. In 1995-1996, however, 75% of households were gambling 1.5% (£3.81) of their weekly income. Grun and McKeigue (2000) argue that this increase in participation and expenditure corresponds to the beginning of the UK’s national lottery. They note that expenditures on other forms of gambling rose by only £0.08 per week during this period according to survey data.
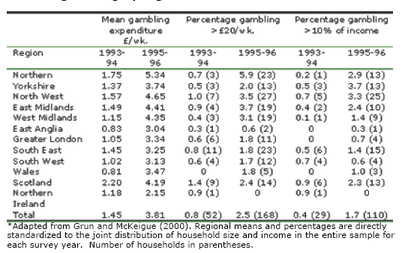
In addition, while all income groups experienced some increase in gambling expenditure between the 1993-94 and 1995-96 surveys, households with income less than £200 per week experienced the greatest gambling expenditure increase. This group increased their mean gambling expenditures from 0.6% to 2.1%; the proportion of these households spending more than 10% of their income on gambling increased by five times (Grun & McKeigue, 2000). As Table 1 illustrates, the average spending on gambling doubled after the introduction of the UK national lottery; among households where gambling expenditures were excessive, there was a four-fold increase of spending (Grun & McKeigue, 2000).
Table 1. Mean gambling expenditure and excessive gambling by region: 1993-94 and 1995-96*
This evidence provides time-limited support for the single distribution theory of gambling. Alternatively, for example, it is possible that Grun and McKeigue (2000) stumbled upon an artifact of newly introduced gambling. That is, expenditures increase when a new gambling form is first introduced to a region. Had the scientists continued to monitor gambling expenditures across these regions for more than one year, expenditures might have diminished as this novelty effect moderated.
Further, this dataset rests solely on self-report. Without validation, self-report data raises concerns about the accuracy of the evidence; this is especially important since the Family Expenditure Survey was not designed specifically for the purposes of this study. Additionally, the excessive gambling cut-off levels “ … were chosen arbitrarily so that the numbers of households above the cut-off would be large enough to tabulate by region and income” (Grun & McKeigue, 2000, p. 962). This subjective procedure leaves us to wonder whether spending £20 per week or 10% of household income is socially, economically or scientifically descriptive of “excessive” gambling. What is “excessive” gambling? Is it conceptually equivalent to problem gambling (i.e., level 2), pathological gambling (i.e., level 3), or a combination of both?
Despite these methodological concerns, Grun and McKeigue (2000) raise the possibility that the single distribution theory can play an important role in predicting the prevalence of disordered gambling. Their research serves to remind scholars and clinicians alike that variables independent of gambling consequences (e.g., availability and access) might be useful factors to predict, explain or simply contribute to the onset of either level 2 or level 3 gambling disorders or a combination of both.
[1] Grun and McKeigue (2000) define “excessive” gambling at the household level as spending more than £20 per week or spending 10% of household income.
[2] A random sample of 10,000 private households are asked to participate in the survey. The response rate is approximately 70% (Grun & McKeigue, 2000).
References
Grun, L., & McKeigue, P. (2000). Prevalence of excessive gambling before and after introduction of a national lottery in the United Kingdom: another example of the single distribution theory. Addiction, 95(6), 959-966.
Office for National Statistics. (1996). Family spending: a report on the 1995-96 Family Expenditure Survey. London: The Stationary Office.
Rose, G. (1992). The Strategy of Preventive Medicine. Oxford: Oxford University Press.
Rose, G. (1985). Sick individuals and sick populations. International Journal of Epidemiology, 14, 32-38.
The WAGER is a public education project of the Division on Addictions at Harvard Medical
School. It is funded, in part, by the National Center for Responsible Gaming, the
Massachusetts Department of Public Health, the Addiction Technology Transfer Center of
New England, the Substance Abuse and Mental Health Services Administration, and the
Center for Substance Abuse Treatment.


