


The two-volume Annual gaming report of the Nova Scotia Alcohol and Gaming Authority weighs just over 4lbs 3oz (1.9kg). An anthology of independent research reports, the Report provides a comprehensive look at the state of gambling in Nova Scotia and in Canada in general. Chapter topics include the socioeconomic impact of gambling, prevalence of problem and pathological gambling, and public opinion of gambling and related activities. One of the more unusual subjects addressed is the relationship between gambling status and household spending habits. That is, do gamblers spend their income differently than non-gamblers?
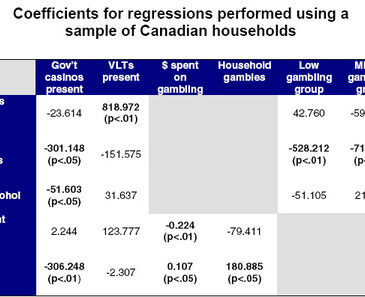
The research report dealing with this issue, Convenience gambling in Nova Scotia: A study of consumer income and expenditure patterns, was prepared for the Authority in October 1999 by MPM Gaming Research. Using a 1996 data set, the minus liabilities authors worked with a sample of 821 households in Nova Scotia and 10,406 households in Canada. Most of the analyses presented use regression modeling to explore the relationships between gambling-related independent variables and various indices of spending behavior. The table below presents the coefficients from multiple ordinary least squares regression. The magnitude of each coefficient indicates the relative strength of the relationship, while the valence of each coefficient (i.e., positive or negative) indicates whether the relationship is direct or inverse. Statistically significant coefficients are in bold type.

With the notable exception of the high-level gambling group, gambling is not significantly associated with a decline in net worth. The degree of involvement with gambling, defined here as total amount spent, is associated with lower levels of retirement savings. That is, as total gambling expenditure increases, the change in retirement savings decreases.
Amount spent on charitable contributions is inversely correlated with the presence of a government casino as well as with membership in all three groups of gamblers. However, this finding does not necessarily mean that gambling causes lower levels of charitable giving.
One particularly interesting finding is the relationship between gambling and household expenditure on alcohol. Living in an area where government casinos are present is negatively associated with the amount spent on alcohol. Perhaps households in areas with government casinos place alcohol and gambling in the same budget category, so that more money spent on gambling means that less money is available for alcohol purchases. Membership in the high-level gambling group is, however, positively associated with alcohol expenditure.
The relationships discussed above represent only a small fraction of the data presented in the Annual gaming report. Future WAGERs will discuss other notable finding from this heavy work.
References
MPM Gaming Research. (1999). Convenience gambling in Nova Scotia: A study of consumer income and expenditure patterns. Annual gaming report. Nova Scotia: Alcohol and Gaming Authority.