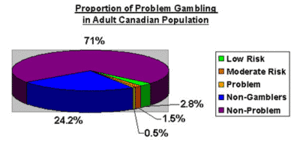
Large health surveys can provide insight into the health risks associated with gambling as well as provide a detailed picture of population segments with gambling-related problems. These surveys help us discover the prevalence of behaviors or qualities that are common or rare in a given population without having to rely on anecdotes or more narrow studies that might be misleading about general trends. Cycle 1.2 of the Canadian Community Health Survey – Mental Health and Well-being (CCHS 1.2) provides information about gambling behavior in provinces throughout Canada using the Canadian Problem Gambling Index (CPGI; see WAGER 9(3) for a description of the CPGI and its development) as a diagnostic indicator of gambling problems. This week, the WAGER reviews a recent study that used the CPGI to glean information about the prevalence of gambling problems in Canada (Marshall & Wynne, 2003).
Marshall and Wynne implemented the 2002 CCHS 1.2 to interview one randomly selected citizen aged 15 years or older from each private dwelling sampled within the ten provinces of Canada: the ten provinces account for approximately 98% of the Canadian population. The authors did not survey residents of the three territories, Indian reserves or Crown lands, institutions, certain remote regions and full-time members of the Canadian Armed Forces. The researchers achieved a 77% response rate and collected a final sample of about 36,984 respondents. The sample drew proportionally from each of the provinces according to size, and collected information using a Computer-Assisted Personal Interviewing (CAPI) version of the CPGI as well as other related gambling questions. Researchers interviewed most participants in-person; however, 14% were interviewed by telephone when this was the only option.
The study revealed that, during the past year, 5% of the total population and 6% of all people who participate in gambling experienced “problem gambling” or “at-risk” behavior for future gambling problems (i.e., “low-risk” gamblers or “moderate-risk” gamblers)1. Groups that most commonly experienced problem gambling or at-risk gambling behaviors were men, Aboriginal persons, the less educated, Video Lottery Terminal players, and those who play frequently. Problem gamblers or those at-risk had higher rates of financial and relationship problems. Most notably, in the past year, problem gamblers suffered higher levels of alcohol dependence, stress, emotional distress, and past depression compared to non-gamblers and low-risk gamblers. In the past year, most problem gamblers (85%) recognized their problem and, within that time, most (56%) reported unsuccessful quit attempts. Wynne and Marshall suggested that problem gamblers’ failure to quit perhaps contributed to their high rate of reported suicide contemplation during the last year (18%).
This study paints a vivid portrait of the “at-risk” and “problem” gambler, but some limitations should be taken into account. Although researchers often group “low-risk,” “moderate-risk” and “problem gambling” together for statistical analyses, this procedure could be problematic if researchers do not ensure that these potentially different groups are statistically indistinguishable. For example, in this study, the authors reported that these three subtypes of gamblers–as a group–were associated with higher rates of financial or relationship problems; yet, low-risk individuals comprised about 59% of this cumulative group. The low-risk individuals then might be given undue weight when grouped with a small number of gamblers facing very serious and imminent gambling problems.
For its sheer breadth, this study provides important information about the demographics and behavior patterns associated with problem, potential problem, and likely recovering gamblers. Population-based research such as this offers a rich insight into broad trends that typically are not available through small sample research or anecdotal evidence that fail to capture the texture of a large population.
Comments on this article can be addressed to Michael Stanton.
Notes
1 The authors define the CPGI gambling groups as follows:
non-problem gambling = gamble infrequently (less than five times per year), declare themselves not gamblers, or score zero on the PGSI.
low-risk gambling = respondent most likely experiences no adverse consequences of gambling, but responded affirmatively to two or more indicators of problem gambling
moderate-risk gambling = respondent might have experienced adverse consequences of gambling and responded affirmatively to three or four indicators of problem gambling
problem gambling = respondent experiences adverse consequences of gambling and responded affirmatively to between eight and twenty-seven indicators of problem gambling.
References
Marshall, K., & Wynne, H. (2003). Fighting the Odds (No. Catalogue no. 75-001-XIE): Statistics Canada.


