


The workplace can produce a variety of stressors that can relate to the tasks and responsibilities at hand. Though employees might try to avoid such stress by leaving their place of work, it is possible that stressors encountered at work carry over to the home and beyond. A recent study by Richman, Zlatoper, Zackula Ehmke, and Rospenda (2006) examines the relationship between workplace stressors, specifically sexual harassment (SH), generalized workplace abuse (GWA), and psychological workload (PWL), and the impact of these stressors on drinking behavior during retirement.
For this study, researchers used data from a cohort of university employees. The baseline sample included 2,492 employees. Of the total participants at baseline, 1,654 (918 women, 736 men) completed all four mail surveys (1996, 1997, 2001, and 2002); of those who completed all four surveys, 1,086 full-time workers (94%) and 71 retirees (6%) reported ever drinking, and were, consequently, eligible to for this analysis. The surveys included several instruments, including: the Sexual Experiences Questionnaire (SEQ; Fitzgerald, 1990), which measured SH; the “psychological job demands” scale, selected from the Job Content Questionnaire (Karasek & Theorell, 1990), which measured PWL; and an instrument developed by Richman and colleagues (Richman et al., 1999) which measured GWA. The researchers also included questions about frequency of alcohol consumption and the quantity of alcohol consumed (Richman et al., 1999) in the questionnaire. The authors performed hierarchical multiple regressions to predict number of days of drinking in a month (i.e., Time 4 drinking frequency) and number of drinks per day (i.e., Time 4 drinking quantity).
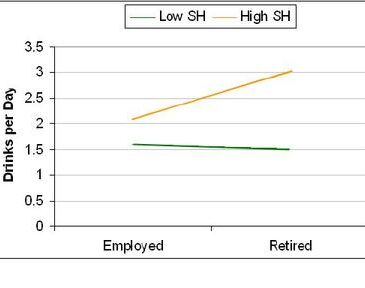
There was no significant gender effect in the analysis of SH. Those participants who were retired and who reported high SH drank significantly more alcohol than their working counterparts, while those who reported low SH drank less, both when working and retired. See Figure 1 for an illustration. For drinking frequency, only baseline (i.e., Time 1) drinking quantity and education made significant contributions to the prediction model.

Figure 1. Sexual harassment (SH) and drinking quantity among employed and retired workers (adapted from Richman et al., 2006)¹. Click image to enlarge.
In the analysis of GWA, the baseline measure of drinking frequency and education made significant contributions to the estimation of drinking frequency at Time 4. Retired men and women who reported high GWA reported significantly higher frequency of drinking than their working counterparts and those who experienced low GWA. Retired women who experienced low GWA drank less frequently then their employed counterparts. See Figure 2 for an illustration. Baseline drinking quantity, age, race, and education made significant contributions to estimation of drinking quantity at Time 4; GWA and gender were significant in step two of the statistical analysis.

Figure 2. Generalized workplace abuse (GWA) and drinking frequency among employed and retired workers (adapted from Richman et al., 2006)². Click image to enlarge.
Gender also was a significant predictor of PWL. In this analysis retired men who experienced low PWL and retired women who experienced high PWL drank more than their working counterparts, while men who experienced high PWL and women who experienced low PWL drank less than their working counterparts. See Figure 3 for an illustration. For drinking frequency, only baseline drinking quantity, and education made significant contributions to the predictive model.

Figure 3. Psychological workload (PWL) and drinking quantity among employed and retired workers (adapted from Richman et al., 2006)³. Click image to enlarge.
There are several limitations to the study. The sample was followed only for a period of six years; it is unclear whether these patterns will continue long after retirement. Also, only a small portion of the sample actually was retired by 2002; thus, it might be difficult to generalize these results to retirees in general. Lastly, all participants in this study worked at the same university; it is unclear how the findings would change if a broader spectrum of professions were included.
Nonetheless, the results of this study suggest that there is a relationship between drinking in retirement and high SH and high GWA for men and women, and high PWL but only for women. This could mean that workplace stressors could continue to have an impact on a person’s drinking habits even after the stressors themselves are removed (e.g., Posttraumatic stress). These findings highlight a new segment of the population that might be at risk for alcohol abuse and/or dependence. These findings are important to consider as a growing number of people are approaching or are at this stage of life; coupled with gradually increasing life expectancies, these issues could become increasingly significant in the coming years as we experience a population surge among this population segment. Given the growing number of “baby boomers, ” future research should determine the impact of these stressors during the longerterm during retirement, and how these issues might best be addressed.
—Siri Odegaard
What do you think? Please use the comment link below to provide feedback on this article.
________________
[1] SH mean drinks per day [SD]. Low SH: employed 1.59 [0.86], retired 1.52 [0.87]; High SH: employed 2.09 [1.49], retired 3.00 [2.37].
[2] GWA mean drinking days per month [SD]. Low GWA Male: employed 8.87 [8.73], retired 10.00 [12.32]; High GWA Male: employed 7.48 [7.59], retired 18.17 [11.03]; Low GWA Female: employed 5.68 [6.90], retired 3.11 [7.57]; and High GWA Female: employed 6.14 [7.72], retired 18.33 [13.60].
[3] PWL mean drinks per day [SD]. Low PWL Male: employed 1.98 [1.38], retired 2.43 [2.07]; High PWL Male: employed 1.74 [1.09], retired 1.2 [0.45]; Low PWL Female: employed 1.72 [1.00], retired 1.00 [0.00]; and High PWL Female: employed 1.63 [0.95], retired 2.00 [1.41].
References
Fitzgerald, L. F. (1990). Sexual harassment: The definition and measurement of a construct. In M. A. Paludi (Ed.), Ivory power: Sexual harassment on campus. Albany, NY: State University of New York Press.
Karasek, R. A., & Theorell, T. (1990). Healthy work: Stress, productivity, and the reconstruction of working life. New York: Basic Books.
Richman, J. A., Rospenda, K. M., Nawyn, S. J., Flaherty, J. A., Fendrich, M., Drum, M. L., et al. (1999). Sexual harassment and generalized workplace abuse among university employees: Prevalence and mental health correlates. American Journal of Public Health, 89(3), 358-363.
Richman, J. A., Zlatoper, K. W., Zackula Ehmke, J. L., & Rospenda, K. (2006). Retirement and drinking outcomes: Lingering effects of workplace stress? Addictive Behaviors, 31(5), 767-776.