


This week, we begin a DRAM series focusing on driving under the influence (DUI). DUI is one of the leading public health threats related to addiction. The Division on Addictions receives funding from the Century Council, bwin Interactive AG, and the National Institutes of Health, among others. The Century Council funding supports our work to develop an assessment tool for use in DUI programs. As part of our work in this project, we have conducted a thorough review of recent research on the development of DUI behavior, its persistence, and effective prevention and intervention tools. The next five issues of the DRAM will focus on this body of recent DUI research and the new insights that have emerged from it.
Introduction
Much of what we know about driving under the influence (DUI) behavior in the United States derives from statistics collected and analyzed by the National Highway Traffic Safety Administration (2010). However, most of the data presented annually by NHTSA involves alcohol-related motor vehicle (MV) fatalities. This week, the DRAM provides a review of DUI trends based on five data sources: motor vehicle fatality data, arrest records, national roadside surveys, self-report data, and passenger reports.
Methods
- Alcohol-Related Motor Vehicle Fatalities
- Data are derived from the NHTSA Traffic Safety Facts reports for 1993 through 2010 (NHTSA 1993-2010).
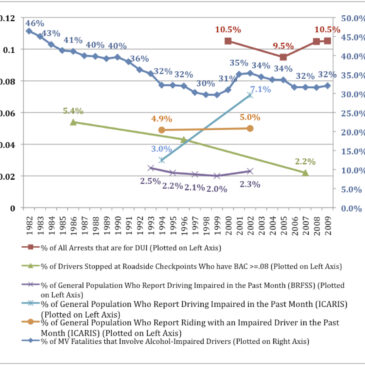
- The Figure presents the percent of all motor vehicle fatalities in a year that involved an alcohol-impaired driver.
- DUI Arrests
- Data are derived from the Federal Bureau of Investigation report on Crime in the United States: 2009 (FBI, 2010).
- The Figure presents the percent of all arrests in a year that are for DUI.
- Roadside Surveys
- Data are derived from the 2007 National Roadside Survey of Alcohol and Drug Use by Drivers (NHTSA, 2009b).
- The Figure presents estimates of the percent of all Friday and Saturday nighttime drivers (10pm-3am) who have BACs over the legal limit.1
- Self Report DUI Behavior
- Data are derived from the Injury Control and Risk Survey (ICARIS) and the Behavioral Risk Factor Surveillance System (BRFSS), both nationally representative telephone surveys of US adults (Dellinger, Bolen, & Sacks, 1999;Quinlan et al., 2005; Shults, Kresnow, & Lee, 2009).
- The Figure presents percent of adult drivers who report driving after having had too much to drink during the past month.1
- Passenger Report DUI Behavior
- Data are derived from the ICARIS survey (Dellinger, et al., 1999; Shults, et al., 2009).
- The Figure presents the percent of adults who report riding with a driver who had too much to drink in the past month.1
Results
- Different DUI events exhibit a diverse set of patterns across time (see Figure).
- The most complete set of data available, for motor vehicle fatalities, shows that the percent of these fatalities that are alcohol-related has decreased steadily over time, but has remained stable for the past four years.
- Roadside surveys suggest a steady decline in the percent of drivers over the limit across time.
- DUI arrests have remained relatively stable across time, as have passenger estimates of DUI events.
- Self-report estimates vary by sample but suggest that DUI behavior might again be on the rise.

Figure. Rates of different DUI events over time. Note: In 2001, the definition of an alcohol-impaired driver in a MV fatality changed from a BAC of .10 to .08, accounting for the steep increase in the alcohol-related MV fatality data between 2000 and 2001. Click image to enlarge.
Limitations
- Motor vehicle fatality estimates and arrest data only tell us about those who are involved in fatal accidents and those who are apprehended for DUI. This information demonstrates trends in DUI behavior, but it tells us little about the extent of the behavior; fewer than 1% of DUI drivers are arrested for their behavior (Centers for Disease Control, 2010), and far fewer DUI occasions result in fatal accidents.
- Roadside sobriety checkpoints reveal the percent of drivers over the legal BAC limit, but are constrained by time and location.
- Self reports likely underestimate DUI behavior and ambiguous phrasing (i.e., “too much to drink”) may elicit different interpretations of questions.
- Passenger reports avoid these self-report biases, but fail to account for solo DUI events.
Conclusions
DUI is a complex moving target. Each of the variety of methods used to measure this behavior captures a separate facet of DUI behavior and potentially a separate population segment of DUI offenders. For example, it appears that DUI arrests and DUI-related MV fatalities are no longer decreasing; it is possible that current efforts to decrease DUI behavior are not effective within this severe population. The continued decrease in alcohol-impaired drivers at sobriety checkpoints, however, is encouraging and suggests that prevention efforts continue to be effective among those who exhibit less severe DUI behaviors. More research is needed to clarify the varied self-report DUI behavior trends and their interpretation.
— Sarah Nelson & Aaron Lim
What do you think? Please use the comment link below to provide feedback on this article.
________________
[1] The percents derived from the National Roadside Survey and the ICARIS and BRFSS surveys are weighted to make them nationally representative.
References
Centers for Disease Control. (2010). Impaired driving: Get the facts. Retrieved April 19th, 2006, 2001, from http://www.cdc.gov/Motorvehiclesafety/Impaired_Driving/impaired-drv_factsheet.html
Dellinger, A. M., Bolen, J., & Sacks, J. J. (1999). A comparison of driver- and passenger-based estimates of alcohol-impaired driving. Am J Prev Med, 16(4), 283-288.
Federal Bureau of Investigation. (2010). Crime in the United States: 2009. Crime in the United States Retrieved Jan 18, 2011, from http://www2.fbi.gov/ucr/cius2009/data/table_33.html
National Highway Traffic Safety Administration. (1993-2006). Traffic safety facts: Alcohol. Retrieved May 12, 2011, from http://www-nrd.nhtsa.dot.gov/CATS/listpublications.aspx?Id=A&ShowBy=DocType
National Highway Traffic Safety Administration. (2007-2010). Traffic safety facts: Alcohol impaired driving. Retrieved May 12, 2011, from http://www-nrd.nhtsa.dot.gov/CATS/listpublications.aspx?Id=A&ShowBy=DocType
National Highway Traffic Safety Administration. (2009b). Traffic safety facts research notes: Results of the 2007 National Roadside Survey of Alcohol and Drug Use by Drivers. Retrieved May 24, 2010, from http://www.nhtsa.gov/Driving%2BSafety/Research%2B&%2BEvaluation/2007%2BNational%2BRoadside%2BSurvey%2Bof%2BAlcohol%2Band%2BDrug%2BUse%2Bby%2BDrivers
Quinlan, K. P., Brewer, R. D., Siegel, P., Sleet, D. A., Mokdad, A. H., Shults, R. A., et al. (2005). Alcohol-impaired driving among U.S. adults, 1993-2002. American Journal of Preventive Medicine, 28(4), 345-350.
Shults, R. A., Kresnow, M.-J., & Lee, K. C. (2009). Driver- and passenger-based estimates of alcohol-impaired driving in the U.S., 2001-2003. American Journal of Preventive Medicine, 36(6), 515-522.