


Institutions including governments and colleges and universities have implemented policies in an attempt to reduce excessive drinking and mitigate the associated health and economic costs among their populations. However, some of the most effective alcohol control policies lack public support, and this is often a barrier to implementation (Greenfield et al., 2007). This week, as part of our efforts to promote Alcohol Awareness Month, The DRAM reviews a recent study that assessed the relationship between the efficacy of state-level alcohol control policies and the likelihood of their implementation (Nelson et al., 2015).
Methods
- Experts reviewed information about the implementation of 29 state-level alcohol control policies using the Alcohol Policy Information System, and various other public and private databases.[1]
- The data set included alcohol policy information for all 50 states and the District of Columbia from 1999 to 2011.
- Key measures included:
- Whether a policy was implemented in a state (yes or no)
- Policy efficacy rating (ER), as assessed by a panel of 10 policy experts using a modified Delphi method from low efficacy (1) to high efficacy (5).
- Researchers grouped these policies into four categories based on the population (i.e., youth or adults) and behavior they addressed (i.e., binge drinking or impaired driving) as well as their rated effectiveness:
- Effective general population policies had high ER for both populations and both behaviors (e.g., alcohol excise tax, outlet density restrictions)
- Effective youth-oriented policies had high ER among youth only, for both behaviors (e.g., minimum legal drinking age, 21 years, social host laws)
- Effective impaired driving policies had high ER among both populations, only for impaired driving (e.g., sobriety check points); and
- Less effective policies received low ER scores for both populations and both behaviors (e.g., restriction of direct shipment/home delivery of alcohol).
Results
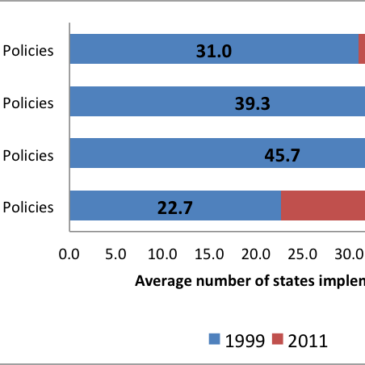
- Figure 1 shows the average number of states implementing these categories of policies during 1999 (blue bars) and the change in number of states from 1999 to 2011 (red bars). [2]
- As Figure 1 shows, policies rated as less effective had, on average, the greatest increase in implementation during the period 1999–2011.
- On average, 4.1 states were more likely to implement effective youth-oriented policies during 2011, compared to 1999.
- Implementation of the other policy types did not change much over time.

Figure 1. States’ Implementation of Alcohol Control Policies, by Policy Type and Year (modified from Nelson et al., 2015). click to enlarge
Note: Blue bars represent average number of states implementing each alcohol control policy by type during 1999. Red bars indicate change in average number of states from 1999 to 2011.
Limitations
- The efficacy ratings are based on the educated opinions of 10 experts who came to consensus. A different group of experts might rank these policies differently.
- The list of policies assessed in this study is incomplete. It only includes policies the panel of experts found at least somewhat effective, and for which data was available for the study period from 1999 to 2011.
- The policies reviewed for this study are specific to the U.S. and might not be generalizable to other countries.
Conclusion
Too often, the development and implementation of state-level policies is not informed by science and “best practices.” Alcohol is one of the most popular legal drugs in the U.S. and generally speaking, policy makers are resistant to use some of the most effective policies (e.g., alcohol excise tax) perhaps because they are less palatable among their constituents. While policy makers agree on the need to reduce risky substance use, this study shows that generally speaking more effective policies are being ignored in favor of policies that target special populations at risk (e.g., youth).
— John Kleschinsky
What do you think? Please use the comment link below to provide feedback on this article.
References
Greenfield, T. K., Ye, Y., & Giesbrecht, N. A. (2007). Views of alcohol control policies in the 2000 National Alcohol Survey: What news for alcohol policy development in the US and its States? Journal of Substance use, 12(6), 429-445.
Nelson, T.F., Xuan, Z., Blanchette, J.G., Heeren, T.C., & Naimi, T.S. (2015). Patterns of change in implementation of state alcohol control policies in the United States, 1999-2011. Addiction, 110(1):59-68. doi: 10.1111/add.12706. Epub 2014 Sep 24. PubMed PMID: 25138287.
[1] The authors note there are 47 total policies, but only 29 have complete data for all states and the full study period.
[2]The results represent the average number of states implementing each policy within the 4 policy types. As an example, during 2011 51 states had 0.08 per se laws; 39 states had sobriety checkpoints; and 49 states had administrative license revocation. The average number of states implementing Effective Impaired Driving Policies was 46.3.