


Over 15% of adults aged 18 and older in the United States have ever used an e-cigarette. This is greater than the combined population of the United States’ top ten largest cities.1 The belief that e-cigarettes are less dangerous than traditional cigarettes is one reason people try e-cigarettes. This week, ASHES reviews a study by Wiseman and colleagues that explored how perceptions about e-cigarettes relate to e-cigarette use among a nationally representative sample.
What is the research question?
How do perceptions of harm and nicotine addictiveness about e-cigarettes, compared to cigarettes, relate to e-cigarette use?
What did the researchers do?
The researchers studied the responses of 3,195 adults collected from the 2015 National Cancer Institute Health Information National Trends Survey. Participants responded to questions about trying e-cigarettes and traditional paper cigarettes, perceptions of relative harms, perceptions of nicotine product addictiveness, perceptions about nicotine (e.g., “Nicotine is the main substance in tobacco that makes people want to smoke”), and whether participants looked for any source of information about cigarettes. The researchers used logistic regression analysis to assess the relationship between perceptions, use of cigarettes, and use of e-cigarettes.
What did they find?
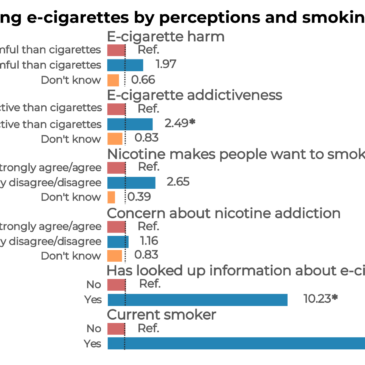
Participants who believed e-cigarettes were less addictive than cigarettes experienced 2.49 significantly greater odds of trying e-cigarettes than those who believed they were just as or more addictive than cigarettes. Similarly, those who were current smokers or looked up information about e-cigarettes were significantly more likely than others to try e-cigarettes. These and additional results are reported in the Figure.

Figure. Odds of trying e-cigarettes compared to the reference group (ref.). Rectangles to the left of the reference line means less likelihood of trying e-cigarettes, while rectangles extending to the right of the reference lines means greater likelihood of trying e-cigarettes. Asterisks represent significant differences from the reference group on trying e-cigarettes. Click image to enlarge.
Why do these findings matter?
This study replicated past research indicating that perceptions about the relative addictiveness of e-cigarettes relate to e-cigarette use. Importantly, perceiving e-cigarettes to be less addictive significantly predicted e-cigarette use regardless of whether participants were smokers or non-smokers. That those who looked up information about e-cigarettes were more likely to try e-cigarettes suggests that public health advocates might not be effectively communicating their messages about the addictiveness and possible harms associated with e-cigarette use. Public health advocates should consider promoting mass media campaigns in popular forums, such as online social media or places with heavy traffic, to help a broader audience come across this information more easily and potentially decrease use.
Every study has limitations. What were the limitations in this study?
Since the researchers did not track smoking behaviors over time, it is unclear whether e-cigarette use came before or after participants developed perceptions about the harms and nicotine content of e-cigarettes. They measured perceived relative harms and addictiveness of e-cigarettes each with a single question, which provides a limited understanding of which specific harms and aspects of addiction participants associate with e-cigarettes.
For more information:
SmokeFree offers tools and tips for quitting and maintaining abstinence from smoking tobacco. For additional tools, please visit the BASIS Addiction Resources page.
— Pat Williams
What do you think? Please use the comment link below to provide feedback on this article.
________________
1The top 10 largest cities in the United States are, in order, New York City, Los Angeles, Chicago, Houston, Phoenix, Philadelphia, San Antonio, San Diego, Dallas, and San Jose.