


The expansion of gambling opportunities raises some
important public health issues. Researchers previously thought that expanded
gambling opportunities would lead to increased rates of gambling and gambling
problems. A growing body of evidence, however, suggests that the relationship
between gambling opportunities and gambling problems is more complicated
(LaPlante & Shaffer, 2007). Iowa provides a setting to examine this
relationship further. Iowa first legalized riverboat casino gambling in 1990,
and then land-based casinos in 2005. There are currently 21 casinos in the
state, up from just seven in 1994. . Today’s WAGER reviews a study (Black,
McCormick, Losch, Shaw, Lutz, & Allen, 2012) exploring trends in gambling
and disordered gambling over time in Iowa using data from three cross-sectional
studies spanning more than 20 years.
Methods
- Researchers analyzed data from three telephone
studies of gambling behavior conducted among randomly selected households in
1989, 1995, and 2012 [1],[2].- All surveys collected demographic information,
as well as the South Oaks Gambling Screen (SOGS) to assess gambling and
disordered gambling.- Gambling participation includes any gambling
regardless of consequences; it is defined by a SOGS score of 1 or higher. - Recreational gambling includes gambling without
experiencing negative consequences; it is defined as a SOGS score of 1 or 2. - Problem gambling is defined by a SOGS score of 3
or 4. - Pathological gambling, the most severe form of
disordered gambling, is defined as a SOGS score of 5 or greater.
- Gambling participation includes any gambling
- The analytic sample for the 1989, 1995, and 2012
studies were 750, 1,500, and 356, respectively. - Response rates were 74%, 57%, and 11% for 1989,
1995, and 2012, respectively.
- All surveys collected demographic information,
- Researchers then compared the rates of lifetime
gambling behavior from the 2012 study to rates from the 1989 and 1995 studies
using chi-squared and Fisher’s Exact Test. Researchers did not report statistical
comparisons between the 1989 and 1995 studies; however, we calculated these
statistics and report them below.
Results
- The rates of gambling participation increased
significantly between 1989 (13.6%) and 1995 (28.3%; χ2 (1) = 60.0, p
< .001). The rate dropped significantly between 1995 and 2012 (17.1%; χ2 (3) = 18.7, p < .001). The 2012 rates were still
significantly higher than in 1989, Fishers Exact Test, p < .05. - In the 2012 study, 17.1% of the sample reported
lifetime gambling participation. This represents a significant drop from 1995 (28.3%,
χ2 (3) = 18.7, p < .001), but a significant increase
from 1989 (13.6%, Fishers Exact Test, p
< .05). The 1995 rate was significantly higher than the 1989 rate, χ2 (1) = 60.0, p < .001 - The rates of problem gambling increased
significantly between 1989 (1.7%) and 1995 (3.5%; χ2(1) = 6.7, p <
.05). The rates decreased from 1995 to 2012 (2.2%), but the difference did not
reach significance, χ2 (1) =
1.5, ns. Problem gambling rates
increased between 1989 and 2012, but this different did not reach significance,
χ2 (1) = 0.57, ns. - The rates of the pathological gambling increased
significantly between 1989 (0.1%) and 1995 (1.9%; Fisher’s Exact Test p < .05). The rates decreased
marginally between 1995 and 2012 (1.4%; χ2
(1) = 0.4, ns). Pathological gambling rates increased significantly between
1989 and 2012, Fisher’s Exact Test p <
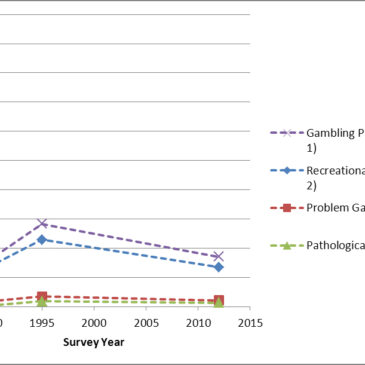
.05. - Figure 1 shows these trends over time.
Figure 1 – Percent
of participants meeting criteria for SOGS score groups over time.

Note: The dotted lines are added for clarity only. They do not indicate the pattern of gambling and gambling problems in between survey years.
Limitations
- The sample size for the 2012 study was
relatively small compared to similar random-digit dialing studies. This is
particularly problematic for conditions with low base-rates like disordered
gambling; in the 2012 study, only 5 people qualified for pathological gambling,
and 8 for problem gambling. - This study relies on self-report data; some
participants might misrepresent or lack insight into their gambling problems. - The response rate for the 2012 study was very
low. Only 11% of those invited to participate were included in the analytic
dataset. - Repeated cross-sectional analyses cannot provide
the same richness of information related to impact as a longitudinal design. By
following the same group of participants over many years, longitudinal designs
help eliminate many sources of bias, and can show us how individuals change and
react over time.
Conclusions
Despite continued gambling expansion in Iowa since the
legalization of casinos during 1990, there is not a linear increase in gambling
participation rates; the percent of residents gambling rose significantly from
1989 to 1995 but dropped significantly from 1995 to 2012. The rates of problem
and pathological gambling showed the same pattern. Rates rose significantly
between 1989 and 1995, but decreased marginally between 1995 and 2012. . Overall,
these results are consistent with an adaptation model proposed by Shaffer
(2005) and LaPlante & Shaffer (2007), which suggests that gambling
participation and problems increases initially with more exposure but peaks and
stabilizes at a lower rate over time. However, true longitudinal research is
needed to fully support or dispel this hypothesis. By following one large,
representative group of people, we can learn how people react over time to
expanded gambling and avoid the ambiguity associated with repeated
cross-sectional surveys. For example, a longitudinal design is required to see
if the same people have disordered gambling over a period time, or if they
recover and others develop problems.
-Daniel Tao
What do you think? Please use the comment link below to
provide feedback on this article.
References
Black, D.W., McCormick, B., Losch, M.E., Shaw, M., Lutz, G.,
Allen, J. (2012). Prevalence of problem gambling in Iowa: Revisiting Shaffer’s
adaptation hypothesis. Annals of Clinical
Psychiatry, 24(4), 279-284.
LaPlante, D.A., Shaffer, H.J. (2007). Understanding the
influence of gambling opportunities: Expanding exposure models to include
adaptation. American Journal of
Orthopsychiatry, 77(4), 616-623.
Shaffer, H.J. (2005). From disabling to enabling the public
interest: Natural transitions from gambling exposure to adaptation and
self-regulation. Addiction, 100, 1227-1230.
[1]
The data collection period for the 2012 study was from 2007-2008.
[2] A
2011 study in Iowa used the NODS, a different measure of disordered gambling.
The results from this study are not directly comparable to the previous
studies, which used the SOGS.
Melvin A. Slawik April 4, 2013
Could the economy affected the results of this study?
Nicolas Foss, NCGC-I April 8, 2013
I think researchers here make a great point that we really need a longitudinal study to be able to understand this better. At this point, even in Iowa, we really don’t have enough data to state for sure that gambling participation increases initially when gambling is a novelty and then decreases. Some data indicate that this may not be the case:
http://www.nydailynews.com/life-style/health/gambling-addicts-seduced-growing-casino-accessibility-article-1.1301339
One thing to note is that the gambling participation seems to stay steady and at a higher rate than when gambling is introduced. As gambling becomes more available, it is likely that the trend continues, which is certainly the case throughout the rest of the country.
Great work, thanks!
Joanne Fendell April 10, 2013
A factor that might not be considered is taxation of gambling revenues in new markets. Pennsylvania taxes slot revenues at 55% and table games at 25%, and Maryland taxes slot revenues at 66%. Compare this to Nevada (7%) and New Jersey (8.5%, which breaks down as 7% tax and 1.5% mandatory investment in Atlantic City).
For a casino operator to make their expected profit in a newer, higher tax market, the games have to have a greater negative expectation to pay the higher taxes. This may lead gamblers to burn out or go broke that much sooner.
Other factors are the growth of so-called “carnival games” like three-card poker (higher house advantage than blackjack or baccarat) and volatility of returns on slot machines. Double Diamond, which has been in use in casinos for 20 years or longer, has a maximum payout of 799:1. Slot machines that pay 5000 coins per coin bet can be found. The growth of so-called penny slots that allow $2.50 a spin or more to be bet and where most of the payout lies in hitting a bonus round, are probably also contributing to the decline in gambling over time.
To answer the other commenter, Pennsylvania had the highest slot revenue in their history in March 2013.