“Wake up, wake up, wake up it's the 1st of the month
To get up, get up, get up, so cash your checks and get up”
–Bone Thugs-n-Harmony, “1st of tha [sic] Month,” from the album E 99 Eternal
The timing of government checks, such as social security, coincides with check recipients’ increase in consumption of essential goods and services. But receiving government checks also coincides with an increase in recipient spending on non-essential goods and services, such as entertainment expenditures (Stephens, 2003). This week’s WAGER reviews a study, which examined whether the timing of government subsidy distribution corresponds with an increase in lottery revenues, and which type of game revenue tends to increase the most.
Methods
- Weinbach & Paul (2008) used lottery sales data from four years in seven states for different types of games (data from LaFleur, 1993; 1994; 1995; & 1996).
- Pick 3 games were less expensive to play, and had small yet frequent payouts.
- Pick 5 games were more expensive to play, and had large yet infrequent payouts.
- In each state, government transfers of funds for three programs (i.e., disability, social security, and Aid to Families with Dependent Children) occurred during the first week of the month.
- The authors used multiple regression analyses to examine if there was a relationship between lottery revenue and weeks in which the government distributed these checks.
Results
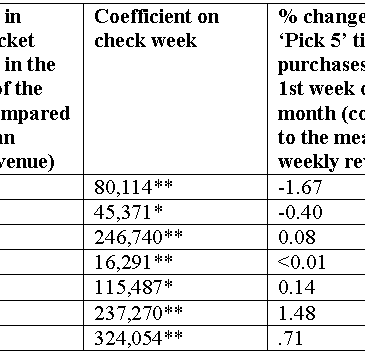
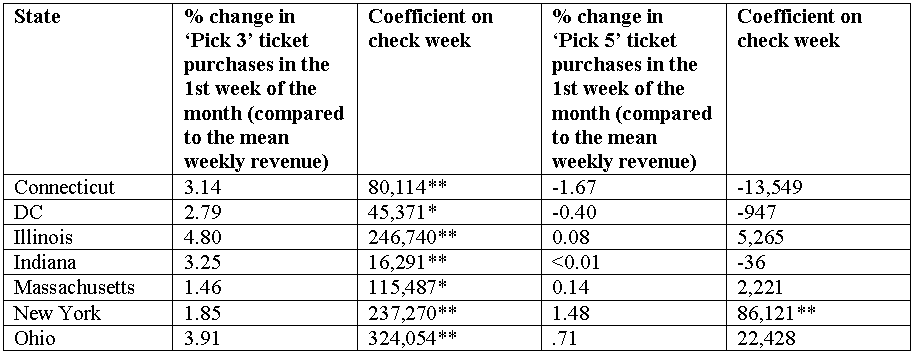
- Table 1 shows that in all 7 states, lottery revenues increased significantly during the first week of the month for Pick 3 games.
- Table 1 also shows that in 6 of 7 states, lottery revenues did not correspondingly increase for Pick 5 games.
Table 1. Pick 3 and Pick 5 revenue change during the 1st week of the month (Adapted from Weinbach et al., 2008).
Limitations
- Data was available for both Pick 3 and Pick 5 games in only seven states, so the number of states available for comparison is limited.
- This study examined large consumer trends; therefore it cannot distinguish recipients of government payments from other consumers.
- For instance, some employers also could distribute paychecks during the first week of the month. If so, the increase in Pick 3 revenues during the first week of the month might be attributed to both government and employer check distribution.
- However, there were no lottery revenue increases during the middle of the month, another common time for employers to distribute checks. Therefore we can assume that first week of the month lottery revenue increases are partially due to government check distribution.
Conclusion
Weinbach and Paul (2008) found an increase in Pick 3 lottery expenditures during the first week of the month; this result is consistent with the finding that government check distribution occurs in tandem with increased spending on essential and non-essential goods and services (Stephens, 2003). However, the authors did not observe such an increase in Pick 5 expenditures. Taken together, these findings indicate that among individuals on a fixed interval reinforcement schedule (such as those receiving government subsidies), games with more frequent, less prolific payouts (e.g., Pick 3 games) more strongly reinforce the purchase of subsequent tickets than games with less frequent, more prolific payouts (e.g., Pick 5 games).
What do you think? Comments can be addressed to Leslie Bosworth.
References
LaFleur, T. (1993). LaFleur's 1993 World Lottery Almanac. Boyds, Maryland: TLF Publications, Inc.
LaFleur, T. (1994). LaFleur's 1994 World Lottery Almanac. Boyds, Maryland: TLF Publications, Inc.
LaFleur, T. (1995). LaFleur's 1995 World Lottery Almanac. Boyds, Maryland: TLF Publications, Inc.
LaFleur, T. (1996). LaFleur's 1996 World Lottery Almanac. Boyds, Maryland: TLF Publications, Inc.
Stephens, M. (2003). 3rd of the month: Do social security recipients smooth consumption between checks? American Economic Review, 93(1), 406-422.
Weinbach, A. P., & Paul, R. J. (2008). Running the Numbers on Lotteries and the Poor: An Empirical Analysis of Transfer Payment Distribution and Subsequent Lottery Sales. Atlantic Economic Journal, 36, 333-344.


