


Gambling and problem gambling are issues that reach across national boundaries. Many nations have conducted surveys to learn more about the gambling habits of their citizens; among them are Australia, Britain, New Zealand, Norway, South Africa, Sweden, Switzerland and the United States as discussed in a WAGER 8(20) and in a paper by Howard Shaffer and his colleagues (Shaffer, LaBrie, LaPlante, Nelson, & Stanton, in press). In June 2004, Statistics Canada published a “Fact-sheet on gambling” in its monthly publication Perspectives on Labour and Income (Statistics Canada, 2004). (1) The figures and statistics included in the fact-sheet are based on data collected from four reports and surveys administered by Statistics Canada, the official source of Canadian social and economic statistics. (2)
The data shows that during the past decade gambling has become increasingly prominent in Canadian households and the national economy. For example, between 1993 and 2003 the growth of the gambling industry in Canada notably surpassed the growth of non-gambling industries.3 Similarly, between 1998 and 2002, the average amount spent per household on at least one gambling activity increased from $462 to $570 (controlling for inflation); however, the percentage of households that reported gambling decreased from 77% to 73% (95% CI = 70%, 71%)4 during this same time period.
Considering the growing presence of gambling within the Canadian economy, Statistics Canada also sought to determine whether certain segments of the population are at risk for problem gambling. To
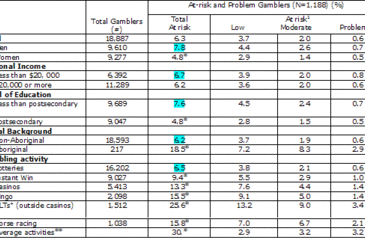
evaluate this, Statistics Canada used data from The Canadian Community Health Survey (1.2, 2002) (CCHS). The CCHS 1.2 is an adaptation of the Canadian Community Health Survey, which is administered every odd-numbered year to investigate the general health of Canadian citizens; surveys given on even-numbered years are modified to have a specific focus. The 2002 survey focused on mental health and included a section on ‘pathological gambling, Table 1 shows that the prevalence rate of the most serious form of gambling disorder among adult respondents in Canada was 0.6% (95% CI = .52%,
.69%)5. This estimate is lower than the estimate of 1.6 (95% CI = 1.35, 1.85) for the highest level of problem gambling, calculated previously in a meta-analysis of 119 prevalence studies in the United States and Canada (Shaffer, Hall, & Vander Bilt, 1999), and the estimate of 1.5 in a more recent paper by Shaffer and his colleagues (Shaffer et al., in press), but not dissimilar to other national estimates of disordered gambling: 0.2 in Norway, 0.5 in New Zealand, 0.6 in Sweden, 0.7 in Britain, and 0.8 in Switzerland (Shaffer et al., in press).
Factors that increase the risk of experiencing a gambling related problem in Canada are similar to the factors identified elsewhere: gender, men are at greater risk for problem gambling than females; education, those with less than a postsecondary education are at greater risk for problem gambling; and racial background, those with an Aboriginal background are about three times as likely to be at risk for problem gambling. The gambling activities that place people at greatest risk for problem gambling are, in descending order of risk, video lottery terminals, horse racing, bingo and casinos.
Table 1: Personal Characteristics and Gambling Behavior

Source: Canadian Community Health Survey (1.2, 2002)
* Statistically significant difference at the .05 level. Tests were done between the at-risk proportion of the reference category and other categories within each variable.
** Significance tests were done between the non-problem and at-risk gambling populations.
+ Video Lottery Terminals
Very little is revealed in the “Fact-sheet on gambling” concerning the individual studies from which the data was derived, and it is therefore difficult to determine the limitations to the methods employed. Nonetheless, these results provide important evidence into the issues surrounding gambling and gambling related problems. When creating programs to prevent problem gambling and gambling related problems, knowing the types of activities that place people at higher risk for developing problem gambling and the population segments at risk for developing gambling related problems, might help create more effective programs. Current statistics do not reveal a level of gambling problems among Canadians distinct from other national groups. Future Canadian Community Health surveys will determine whether the observed increase in money spent on gambling is predictive of an increase in problem gambling.
Comments on this article can be addressed to Siri Odegaard.
Notes
1 A full copy of the report can be found at: http://www.statcan.ca/english/studies/75-001/peonline.htm
2 National Accounts creates annual and quarterly reports of household, business, government, and non-resident incomes and expenditures; The Labour Force Survey collects, monthly, information relating to labor market activity, and industrial and occupational status for everyone over 15; The Survey of Household Spending annually collects information relating to families and individuals living in private homes, including incomes, expenditures, household facilities and equipment; and The Canadian Community Health Survey (1.2, 2002) (CCHS) estimates the prevalence of major mental disorders, issues associated with these disorders, and the degree to which health care addresses these issues.
3 For details, please see graph titled “Gambling outpaced other industries” in “Fact-sheet on gambling,” Perspectives on Labour and Income, June 2004. http://www.statcan.ca/English/studies/75-001/peonline.htm
4 This binomial confidence interval was calculated assuming 20,000 observations, the usual annual number, and simple random sampling procedure.
5 This binomial confidence interval was calculated assuming the survey had 30,000 observations.
6 Analysis of responses was based on classifications such as DSM-IV, and other internationally recognized classification systems:
low-risk gamblers are likely to experience no adverse consequences of gambling, but responded affirmatively to two or more indicators of problem gambling.
moderate-risk gamblers might have experienced adverse consequences of gambling and responded affirmatively to three or four indicators of problem gambling.
problem gamblers had experienced adverse consequences of gambling and responded affirmatively to between eight and twenty-seven indicators of problem gambling.
References
Shaffer, H. J., Hall, M. N., & Vander Bilt, J. (1999). Estimating the prevalence of disordered gambling behavior in the United States and Canada: A research synthesis. American Journal of Public Health, 89(9), 1369-1376.
Shaffer, H. J., LaBrie, R. A., LaPlante, D. A., Nelson, S. E., & Stanton, M. V. (in press). The road less traveled: Moving from distribution to determinants in the study of gambling epidemiology. Canadian Journal of Psychiatry.
Statistics Canada. (2004). Fact-sheet on gambling: Statistics Canada.