


You participate in two lotteries. The first gives you a 5% chance of winning $250, while the second gives you a 30% chance of winning the same amount. Which of the following options seems like a more significant change in the odds?
A) Increase your chance of winning the first lottery from 5% to 10%
B) Increase your chance of winning the second lottery from 30% to 35%
Of 56 undergraduates presented with these choices, three quarters chose option A. However, when given the choice between increasing the probability of winning from 65% to 70% or 90% to 95%, the majority chose the latter. This suggests that respondents believed that an increase from 5% to 10% is more significant than 30% to 35% and an increase from 90% to 95% is more signicant than 65% to 70%. How can these seemingly illogical preferences be explained?
Gonzalez and Wu (1999) investigated this question in a recent study. They illustrate the problem above
algebraically with a mathematical model that represents how individuals distort probabilities when
considering the above options. Although a gambler might think that the probability of winning a bet is p,
he or she might distort that information. Gonzalez and Wu suggest that this distortion is best represented
by a probability weighting function, w. The cognitively distorted probability, w(p), is the probability that
is used by the gambler when making illogical choices. The analysis provided by the authors is far more complex than can be presented here, but certain additional points are worth noting.
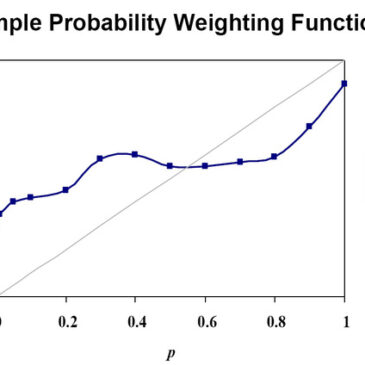
The authors found that, generally, probability weighting functions were graphically represented by an
inverted "S" curve. This means that invidivuals do not interpret proababilities linearly. In addition, the
findings suggest a general tendency to overweight small probabilities and underweight large
probabilities. That is, a small probability of .01 might be distorted in the mind of the gambler and
processed as if it were .05. Similaraly, a relatively high probability of .90 might be processed as .75.
These distortions explain the general inverse "S" shape of the function.
The chart below is a sample of a typical probability weighting function similar to those found empirically by the authors. The present study makes an important contribution that furthers the understanding of the cognitive mechanisms associated with gambling. Rather than asking who gambles, where they gamble, or why they gamble, Gonzalez and Wu address a different question: how gamblers gamble. 
Source: Gonzalez, R, and Wu, G. (1999). On the shape of the probability weighting function. Cognitive Psychology, 38, 129-166.
The WAGER is a public education project of the Division on Addictions at Harvard Medical School. It is funded, in part, by the Massachusetts Council on Compulsive Gambling, the Andrews Foundation, and the National Center for Responsible Gaming. This document may be reproduced, distributed, and quoted provided that proper attribution is given and no changes are made to content or design. Copyright 1999 the President and Fellows of Harvard College.