
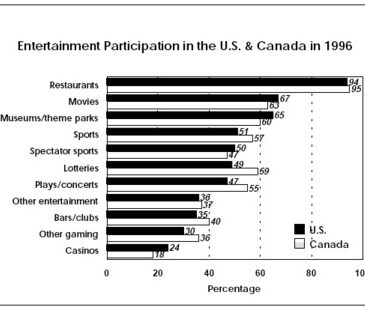


A recent survey of 3,502 adults in Canada and the U.S. examined attitudes and experience with gambling*. Researchers selected the respondents via a random digit dial strategy and interviewed them over the telephone. The respondents reported the entertainment and gambling activities they had engaged in during the past year (1996). The most frequent non-gaming entertainment choices among Canadians and Americans in 1996 were going out to restaurants, movies, visiting musuems or theme parks, and participating in or attending sports events. Unsurprisingly, lotteries were cited as the most popular gaming activity; this finding could be a function of the daily opportunities most people have to play the lottery. During 1996, a greater percentage of Canadians than Americans participated in lotteries, while a larger percentage of Americans than Canadians visited casinos. Participation in lotteries for both Canadians and Americans in 1996 was lower than reported participation in 1995*; 68% of Canadians and 59% of Americans reported playing the lottery in 1995. Although reported levels of participation in the lottery decreased from 1995 to 1996, total lottery sales in Canada and the U.S. increased between fiscal year 1995 and fiscal year 1996**. Canadian FY1995 lottery sales were $5.983 billion, which increased to $6.63 in FY96. In the U.S., FY1995 total lottery sales were $35.48 billion, which increased to $38.98 billion in FY1996. Although calendar years and fiscal years do not precisely correspond, this inverse relationship of participation and expenditure remains interesting. That is, although fewer individuals participated in the lottery in 1996 than in 1995, the average amount spent by individuals who did play in 1996 was more than the average amount spent in 1995.

Sources: *Angus Reid Group. (1996). 1996 North American gaming and gambling study. Calgary, Alberta: Author; **McQueen, P. (1996, October). North American lottery sales report. International Gaming & Wagering Business, 17(10), 73-76. All figures are rounded to nearest ten million.
This public education project is funded, in part, by The Andrews Foundation.