The WAGER Vol 10(4) – Separate Profiles: Gambling Participation and Gambling Problems in the US
In the process of creating effective treatments and prevention programs for any addiction, it is important to identify the populations most likely to experiment with the substance or activity, and the population sub-groups at higher risk for developing problems. A recent issue of The WAGER (9(36)) reviewed a study by Welte and his colleagues which found that even after accounting for crime, substance abuse and gambling behaviors, certain demographic groups were more vulnerable to developing gambling-related problems. This week The WAGER reviews another study by Welte et al. (Welte, Barnes, Wieczorek, & Tidwell, 2004) seeking to determine what pattern of demographic factors increase the likelihood of participating in gambling activities and whether a similar or different pattern would increase the likelihood of experiencing symptoms of problem gambling.
Between August 1999 and October 2000, Welte et al. conducted a nationally representative randomized telephone survey of 2,631 residents of the United States; the response rate was 65.2%. One participant aged 18 years or older was selected at random from each study household. The researchers measured socioeconomic status (SES) using family income, years of education, and occupational prestige. They measured gambling pathology using a combination of the revised South Oaks Gambling Screen (SOGS) (Abbott & Volberg, 1991) and the Diagnostic Interview Schedule (DIS) for the DSM-IV (Robins, Marcus, Reich, Cunningham, & Gallagher, 1996). They defined “combined problem gambler” as a person who reported five or more SOGS or DIS signs or symptoms of a gambling disorder.
The authors presented data using classification trees. Each tree organized data by demographic predictors of a dependent variable: either (1) past year gambling or (2) number of symptoms of gambling pathology. To create these trees, the authors used a Chi-square Automatic Interaction Detector (CHAID, Kass, 1980) analysis. This analysis uses the provided predictors (e.g. gender, race, age, SES, employment, religion, marital status, and region) to divide the data into groups, based on differences in the selected outcome variables. The demographic measures constitute the branches of the tree; the measure that best separates the members of the group on the dependent variable forms the top of the tree, the next most predictive measures constitute the next level of branches on the tree, and so on. CHAID continues to add predictors, or branches, until subgroupings no longer statistically improve the separation of group membership.
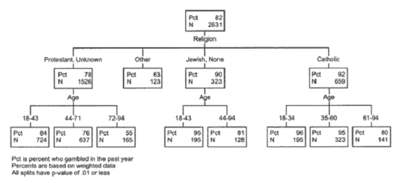
Figure 1 shows predictors for past-year gambling. The most significant predictor was religion: of those surveyed, 92% of Catholics, 90% of Jews, 78% of Protestants and 63% of those identifying with “other” religions reported past-year gambling. “Other” religions included Mormons, Buddhists, Jehovah’s Witnesses, Hindus, and Muslims. Within groups, age was the next most significant predictor of past-year gambling; prevalence decreased with age. Welte et al. argue that religion is a good predictor of past-year gambling because of how these religions view gambling (i.e., traditional Catholic and Jewish moral views are more accepting of gambling (Welte et al., 2004, p. 987)).
Fig.1: Past year gambling (Welte et al., 2004, p. 985)

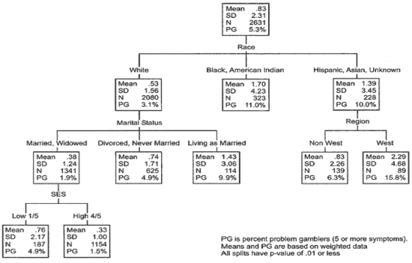
Figure 2 shows the tree classifying people who reported five or more symptoms in the past year. The best predictor for gambling pathology symptoms was race. Blacks and American Indians reported more symptoms than those of Hispanic, Asian or unknown background; Whites reported fewer symptoms than both of these groups. Among Whites, the next most significant predictor was marital status; prevalence was highest among people living as married and lowest among people married or widowed. Among those who are married or widowed, low socioeconomic status was the most significant predictor of gambling symptoms. Among Hispanics, Asians and those of unknown racial background, the most significant predictor was geographic region; those living in the west were much more likely than those living elsewhere to report symptoms. Welte et al. explain the differences between races regarding symptoms of gambling pathology in terms of net worth: because Whites generally have a higher net worth, defined as the value of assets minus debts, than minorities, they might be less likely to suffer from gambling related problems. Net worth also was an important demographic in other research by Welte, et al. as described in an earlier edition of The WAGER (9 (36)).
Fig 2: Number of symptoms of gambling pathology (Welte et al., 2004, p. 987)

According to the two CHAID trees illustrated above, the most significant predictors of past-year gambling and problem gambling are very different: religion and age predict past-year gambling, and race predicts symptoms of problem gambling. Further research might investigate the overlap between these groups of predictors, and the progression from participation in gambling activities to developing gambling-related problems. Also, it is important to have a more comprehensive understanding of “race” as it is used in this context. There are many other factors that might influence these racial groupings (i.e. in the United States racial minorities are more likely to be living in poverty than whites). Though many of these factors were included in the analysis, the trees CHAID creates, because of their categorical nature, do not adequately account for overlap or “covariance” between variables.
To address these limitations, it would be interesting to apply other multi-variate procedures, such as discrimminant function analysis, to this dataset. The CHAID technique identifies the best predictor and then looks within levels of that first predictor for the next best predictor (i.e., religion is the best predictor of gambling, and age is the next best predictor among Protestants). It is possible that when the variables are evaluated continuously and as a set, as discriminant function analysis does, the predictors might be different from those presented in the classification trees above, and might provide a different picture. Nonetheless, it is important to determine what factors, or combination of factors place people at increasing risk for developing gambling problems and other addictive patterns of behavior; Welte et al. bring us one step closer to that goal with this research.
What do you think? Comments on this article can be addressed to Siri Odegaard.
References
Abbott, M., & Volberg, R. (1991). Gambling and Problem Gambling in New Zealand: Report on phase one of the national survey of problem gambling, Research Series (Vol. 12). Wellington, New Zealand: Research Unit, Department of Internal Affairs.
Kass, G. (1980). An exploratory technique for investigating large quantities of categorical data. Applied Statistics, 29 (2), 119-127.
Robins, L., Marcus, L., Reich, W., Cunningham, R., & Gallagher, T. (1996). NIMH diagnostic interview schedule: Version IV (DIS-IV). St. Louis, MO: Washington University.
Welte, J. W., Barnes, G. M., Wieczorek, W. F., & Tidwell, M.-C. (2004). Gambling participation and pathology in the United States: A sociodemographic analysis using classification trees. Addictive Behaviors, 29, 983-989.