The WAGER Vol. 9(46) – Taking a Tour of the Spin Factory
After a fierce battle for the White House, George Bush narrowly defeated his opponent by winning the popular vote 51% to 48%. The red states claim this statistic as proof of an electoral mandate; the blue states claim this shows the country is more divided than ever before. Both camps are using the same election results to support their claims, yet they are arriving at conflicting conclusions. This circumstance probably doesn’t surprise the election-savvy reader.
Not only do the political parties interpret descriptive statistics differently, they also selectively present only statistics that reinforce their position. To illustrate, in a speech immediately following the recent election (White House statement excerpts, 2004), White House chief of staff Andrew Card announced that Bush had won by a “decisive margin of victory” and offered as proof the fact that “President Bush received more votes than any presidential candidate in our nation’s history.” Card did not mention that Kerry also received more votes than any previous presidential candidate in history. The large voter turnout enabled both candidates to claim this distinction. By citing only the absolute number of votes, and only those for one candidate, Card could spin the evidence to support a conclusion that was somewhat misleading. When the percentage of the popular vote is used as the evidence, Bush actually won the election with the smallest margin of victory for a sitting president in U.S. history (U.S. presidential election, 2004).
Spin is not only a prerogative of the political pundits. Descriptive statistics also can be selectively presented to convey certain ‘findings’ in research – a field that strives for scientific objectivity. What researchers choose to include and what they choose to leave out shapes how readers interpret their findings. In an autumn filled with political polling, the WAGER decided to examine the evidence and conclusions from an ongoing gambling survey. This week we present politically-oriented findings from a gambling research poll by Harrah’s Entertainment (Harrah’s Entertainment Inc., 2004) to illustrate the pliability of descriptive statistics.
Harrah’s Survey compiled data from two sources – the National Profile Study and the U.S. Gambling Panel – to create national profiles for casino gamblers and non-gamblers. The National Profile Study mailed surveys during April 2004 to 3,475 adults aged 21 and above; 2,207 (64%) surveys were returned. The U.S. Gaming Panel study mailed surveys in 2003 to 100,000 adults aged 21 and above; 67,575 of these (68%) were returned.
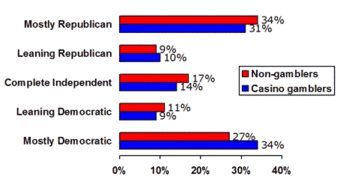
Figure 1 shows political party affiliation, broken down by gambling status. The figure below encourages the impression that non-gamblers are more likely to be Republicans and gamblers are more likely to be Democrats. It is important to note, however, that no statistical tests were presented to confirm statistically whether this initial impression is scientifically accurate.
Figure 1. Political party affiliation

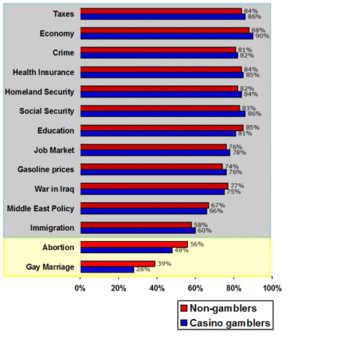
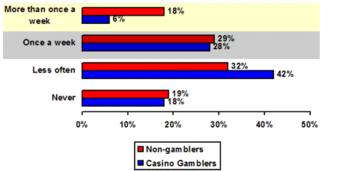
Like the political pundits, we can selectively choose other descriptive data from the Harrah’s Survey to argue that there are wide ideological differences between gamblers and non-gamblers – or to make a case for the opposite, that there is no difference. It is a matter of selective representation or “spin.” For example, we will use the statistics presented below on presidential issues (Figure 2) and religious worship (Figure 3) to demonstrate how partial information can mislead.
Using the statistics highlighted in grey, we can argue from Figure 2 that gamblers and non-gamblers do not differ significantly on what they rank as important issues swinging their vote for president. Further, as seen in Figure 3, gamblers and non-gamblers attend religious services once a week in equal numbers (i.e., 28% and 29% respectively) and thus are not likely to differ ideologically on issues that often polarize religious and secular groups.
Alternatively, focusing on the statistics highlighted in yellow, we can use Figure 2 to cite wide differences in the importance placed on abortion and gay rights as issues determining the vote of non-gamblers compared to gamblers. Further, we could raise the possibility of ideological differences on these two issues based on statistics from Figure 3 that show increased numbers of non-gamblers attending religious services more than once a week (18% compared to just 6% of gamblers). It is important to note that while this argument sounds logical, there is no evidence in this dataset to support such a link – just our spin. Descriptive statistics can tell a compelling story. The problem is that when many different statistics are available, the variation among the statistics permits pundits to use them selectively, spinning them to tell almost any story.
Figure 2. Issues that are extremely important or very important in determining the respondent’s vote for the presidential election

Figure 3. Attendance at a place of worship
Researchers endeavor to be objective, both in the questions they ask and the results they present. However, conditions such as funding constraints and research designs may subtly influence the final product. Readers should be aware of these issues when interpreting results. No single study is sufficient. Instead, a body of evidence is required for knowledge to emerge. For example, the prevalence estimates of adult pathological past-year gambling derived by Shaffer et al. (1999) have been supported around the world by different investigators using a variety of investigative methods. This pattern of replications provides increased confidence in the estimates.
While scientists try to present the most accurate and complete picture of a phenomenon possible through research, how advocates on all sides of the gambling divide use their work is often out of their hands. Advocates tend to use only the evidence that supports their position and ignore the rest. Consequently, a critical skill for any consumer of this information is to learn how to differentiate between responsible representation of research and mere spin.
Comments on this article can be addressed to Rachel Kidman.
References
Harrah’s Entertainment Inc. (2004). Harrah’s Survey ’04: Profile of the American Casino Gambler. Retrieved November 15, 2004, from
http://www.harrahs.com/about_us/survey/2004_Survey.pdf
Shaffer, H. J., Hall, M. N., & Vander Bilt, J. (1999). Estimating the prevalence of disordered gambling behavior in the United States and Canada: a research synthesis. American Journal of Public Health, 89, 1369-1376
U.S. presidential election, 2004. Retrieved November 12, 2004, from
http://en.wikipedia.org/wiki/U.S._presidential_election,_2004
White House statement excerpts. (2004). Retrieved November 12, 2004, from
http://news.bbc.co.uk/1/hi/world/americas/3978315.stm
