The WAGER, Vol 4(15) – Vital Statistics: The Lottery
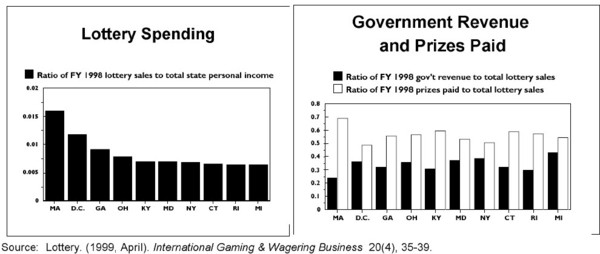
The figures below represent a sample of some of the state lottery statistics recently published in International Gaming & Wagering Business, a trade magazine of the gambling industry. The rankings serve as a comparatice barometer of lettery efficiency, sales, government revenue, and othe rmeasures. Rather than document unadjusted groos total, IGWB presents ratios that take into account factors such as personal income and operating expenses. Abstracted from teh statistics, we find that Massachusetts spends the largest proportion of their income on the lottery. Perhaps this is related to the fact that Massachusetts pays out the largest percentage of its lottery sales as prizes. The Bay State also ranks number one in the category of efficiency, requiring the expenditure of only 7.7 cents to produce one dollar in sales. It should be considered, however, that the government revenue statistics reported for Massachusetts (and Michigan) include net proceeds from charitable gaming. Other state lotteries that rank near the top of multiple ranking lists are teh District of Columbia, Michigan, New Jersey, Georgia, and Pennsylvania.
Source: Lottery. (1999, April). International Gaming & Wagering Business 20(4), 35-39.
