The WAGER, Vol. 3(1) – Meta-analysis of disordered gambling in the US and Canada
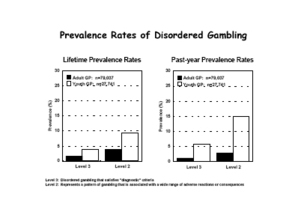
During the past two decades, there has been a broad expansion of gambling (e.g., lottery, casino, and charitable) across the United States and Canada. This social and economic development has prompted researchers and policy makers to ask questions about the extent of disordered gambling. A recent study quantitatively integrated the findings of previously conducted independent disordered gambling prevalence studies. The purpose of this meta-analysis was to establish more precise estimates of the prevalence of this phenomenon than is available from any single study. One hundred twenty of 152 identified studies’ results were analyzed in the meta-analysis. Collinearity (multiple patterns of correlation among data) among these independent studies contributed to the difficulty in understanding the meaningfulness of different prevalence estimates. For example, studies with the lowest prevalence rates were those conducted among adults from the general population; these studies also evidenced the largest sample sizes and high-quality methods. The meta-analysis provided estimates of disordered gambling across various levels of severity. Level 3 refers to disordered gambling that satisfied “diagnostic” criteria. Level 2 gambling represents a pattern of gambling that is associated with a wide range of adverse reactions or consequences. Level 2 gamblers represent people who may be moving in either of two directions: some level 2 gamblers are moving toward an increasingly disordered state, while others are moving toward gambling with no adverse consequences (level 1). It also is possible that level 2 gamblers may not be moving at all. This study identified lifetime level 3 prevalence rates as follows: among adults from the general population (GP)–1.6%, within a 95% confidence interval of 1.35% to 1.85%; among GP youth–3.88%, within a 95% confidence interval of 2.33% to 5.43%. Past-year level 3 prevalence rates include: among GP adults–1.14%, within a 95% confidence interval of 0.90% to 1.38%; among GP youth–5.77%, within a 95% confidence interval of 3.17% to 8.37%. This study identified lifetime level 2 prevalence rates as follows: among adults from the general population (GP)–3.85%, within a 95% confidence interval of 2.94% to 4.76%; among GP youth–9.45%, within a 95% confidence interval of 7.62% to 11.27%. Past-year level 2 prevalence rates include: among GP adults–2.8%, within a 95% confidence interval of 1.95% to 3.65%; among GP youth–14.82%, within a 95% confidence interval of 8.99% to 20.66%.

This public education project is funded, in part, by The Andrews Foundation.
This fax may be copied without permission. Please cite The WAGER as the source.
For more information contact the Massachusetts Council on Compulsive Gambling, 190 High Street, Suite 6, Boston, MA 02110, U.S.